
Omni
Sep 30, 2026
Clear Street
How to Use AI to Analyze the Market
.avif)
Learn how to use AI to analyze the stock market. We cover 6 ways to streamline your pre-market workflow and enter each trading session with a sharper edge.
Introduction
Your pre-market routine probably looks something like this: open a dozen tabs, glance at index futures, skim macro headlines, and trace sector rotation to figure out if today is leaning risk-on or risk-off. It’s an essential part of how you approach the trading session, but doing it manually is fragmented, repetitive, and time-consuming.
AI dramatically improves this workflow by acting as a digital copilot to aggregate data, connect the dots, and synthesize broad market trends. It gives you the market context you need in seconds, eliminating the mental fatigue that so many traders experience before the market even opens.
In this guide, we’ll cover 6 actionable ways to analyze the market with AI, cut your prep time in half, and approach every trading day with a stronger edge.
Choosing the right AI tool for market analysis
Before we dive in, it’s important to know that not every AI chatbot is capable of deep market analysis. In fact, most aren’t.
ChatGPT, Claude, and other all-purpose LLMs don’t have access to live market data, so they often fail at real-time analysis or simply make up numbers. They also struggle with basic math, so they’re unreliable at calculating implied volatility, market breadth, and other key metrics.
What you need instead is a trading-aware chatbot like Clear Street’s Omni AI. Omni AI is built for market analysis and connected to Clear Street’s Model Context Protocol (MCP) server for trading, which gives the chatbot access to live price quotes, institutional-grade financial data, and reliable market calculations.
This combination of real-time data and conversational intelligence streamlines your pre-market workflow and delivers insights you can actually use to trade.
Now that you’ve got the right AI tool in place, let’s dive into ways you can use Omni AI to analyze the market.
1. Analyze market news and sentiment
Reading and analyzing market news in real-time is key to staying ahead of market moves. But the flood of information every day means it’s essentially impossible to digest it all. Worse, trading off headlines often results in emotional decision-making rather than a real edge.
AI can help by processing enormous volumes of market news and summarizing it in a format that’s actionable. Instead of reading dozens of articles, ask AI to summarize yesterday's core market drivers and highlight which specific tickers reacted. When news breaks, ask AI to give you a quick summary of the catalyst and what it will likely mean for different asset classes.
Example prompt: What were the 3 most important news headlines driving the market yesterday, and what tickers reacted most strongly to each piece of news?
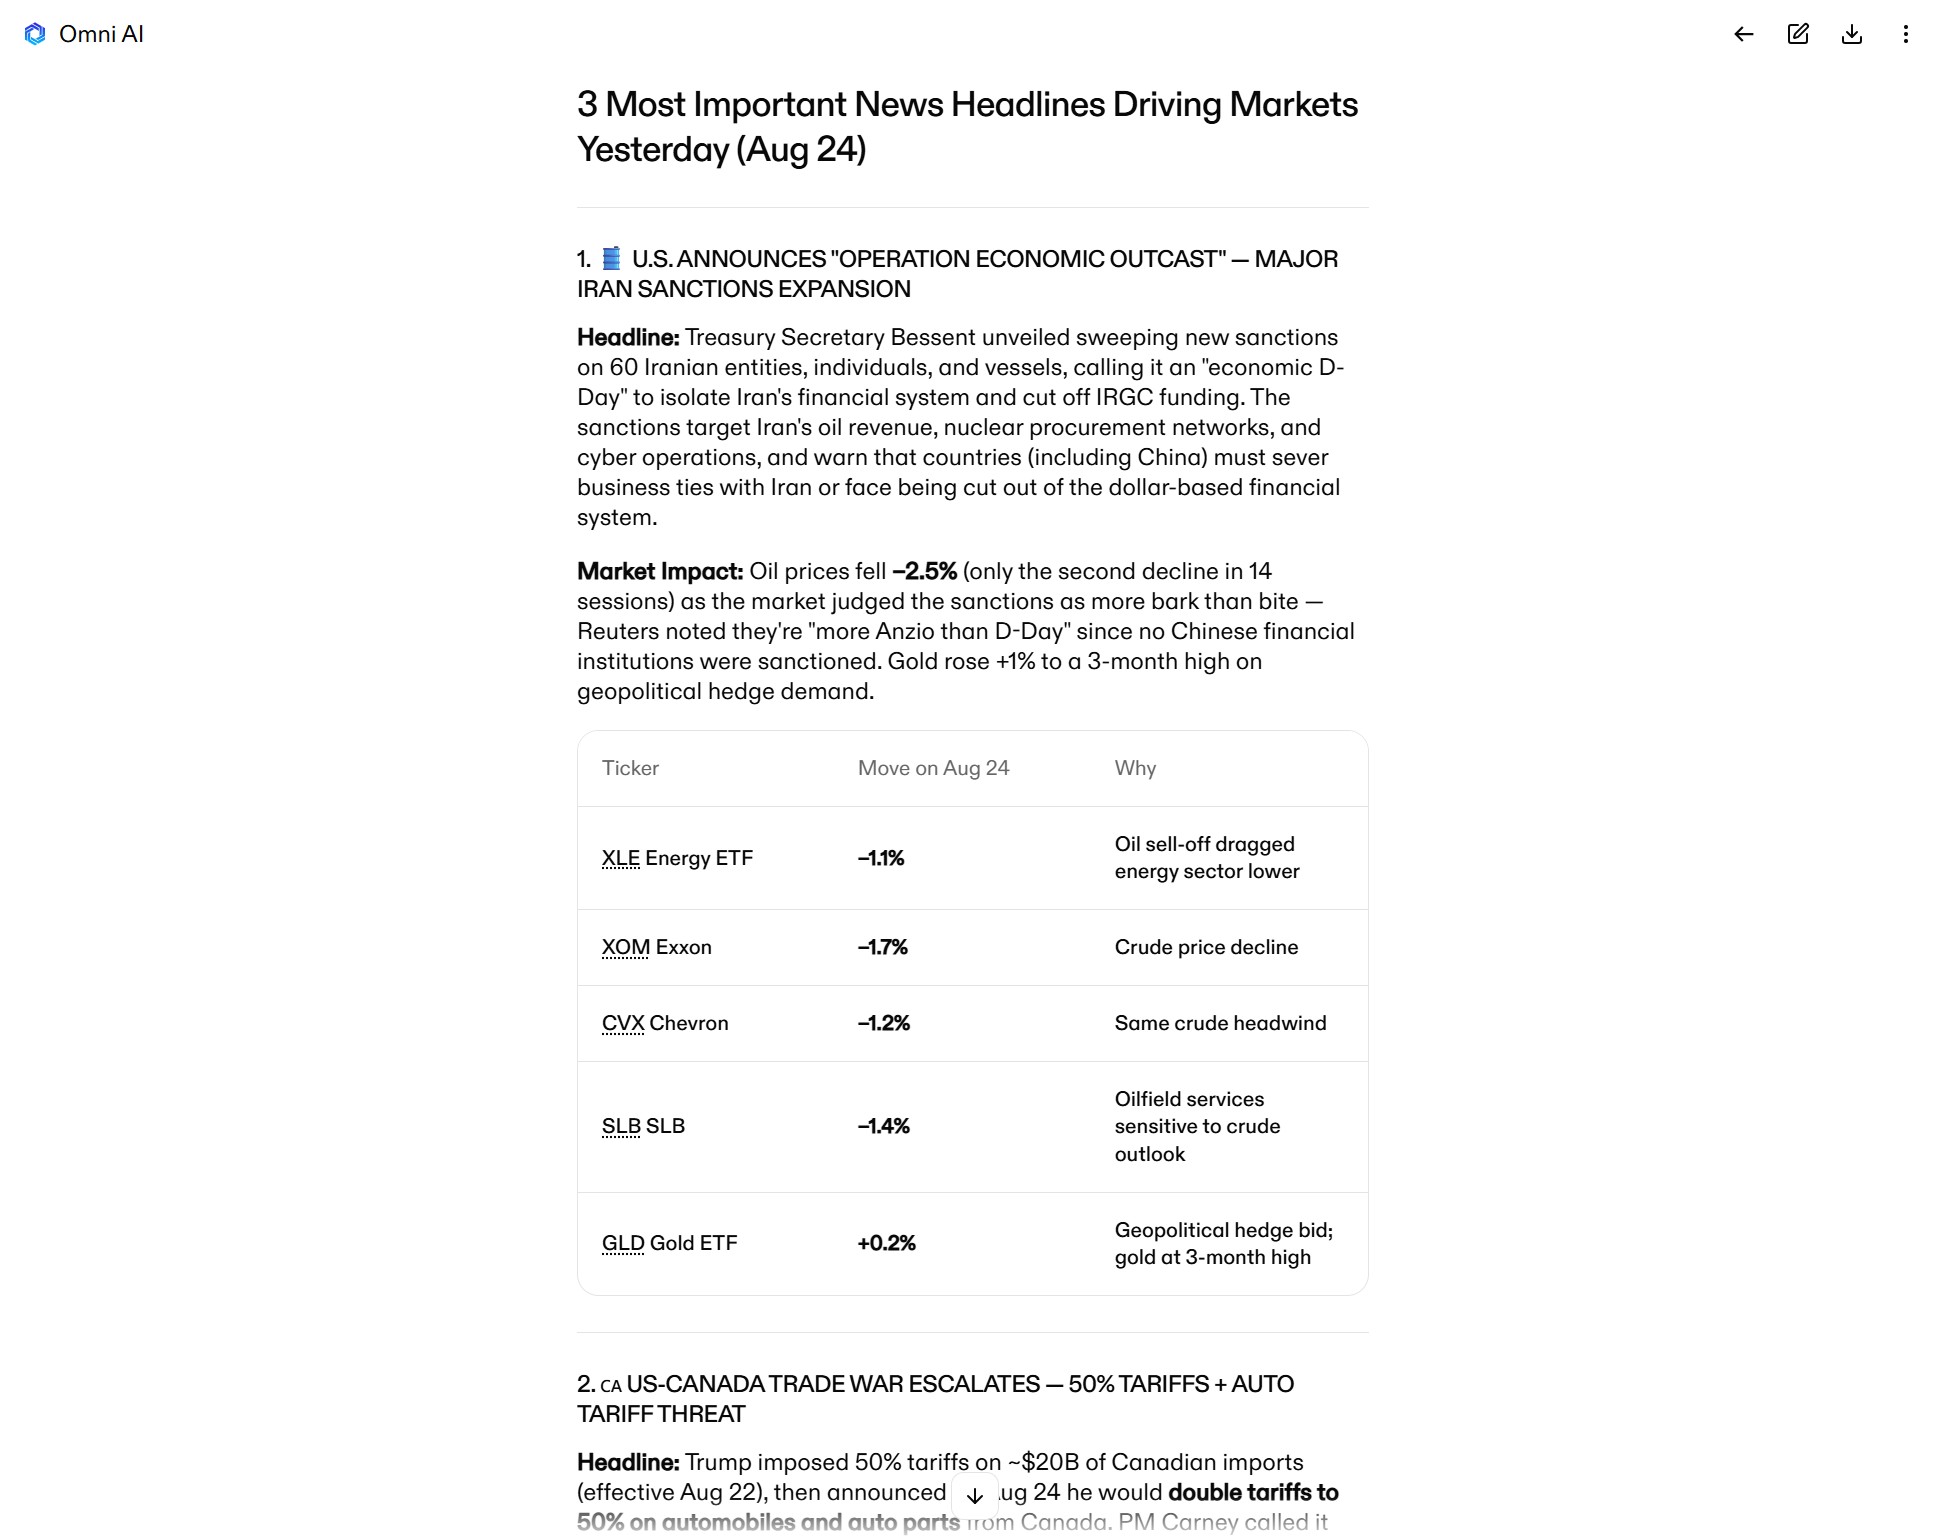
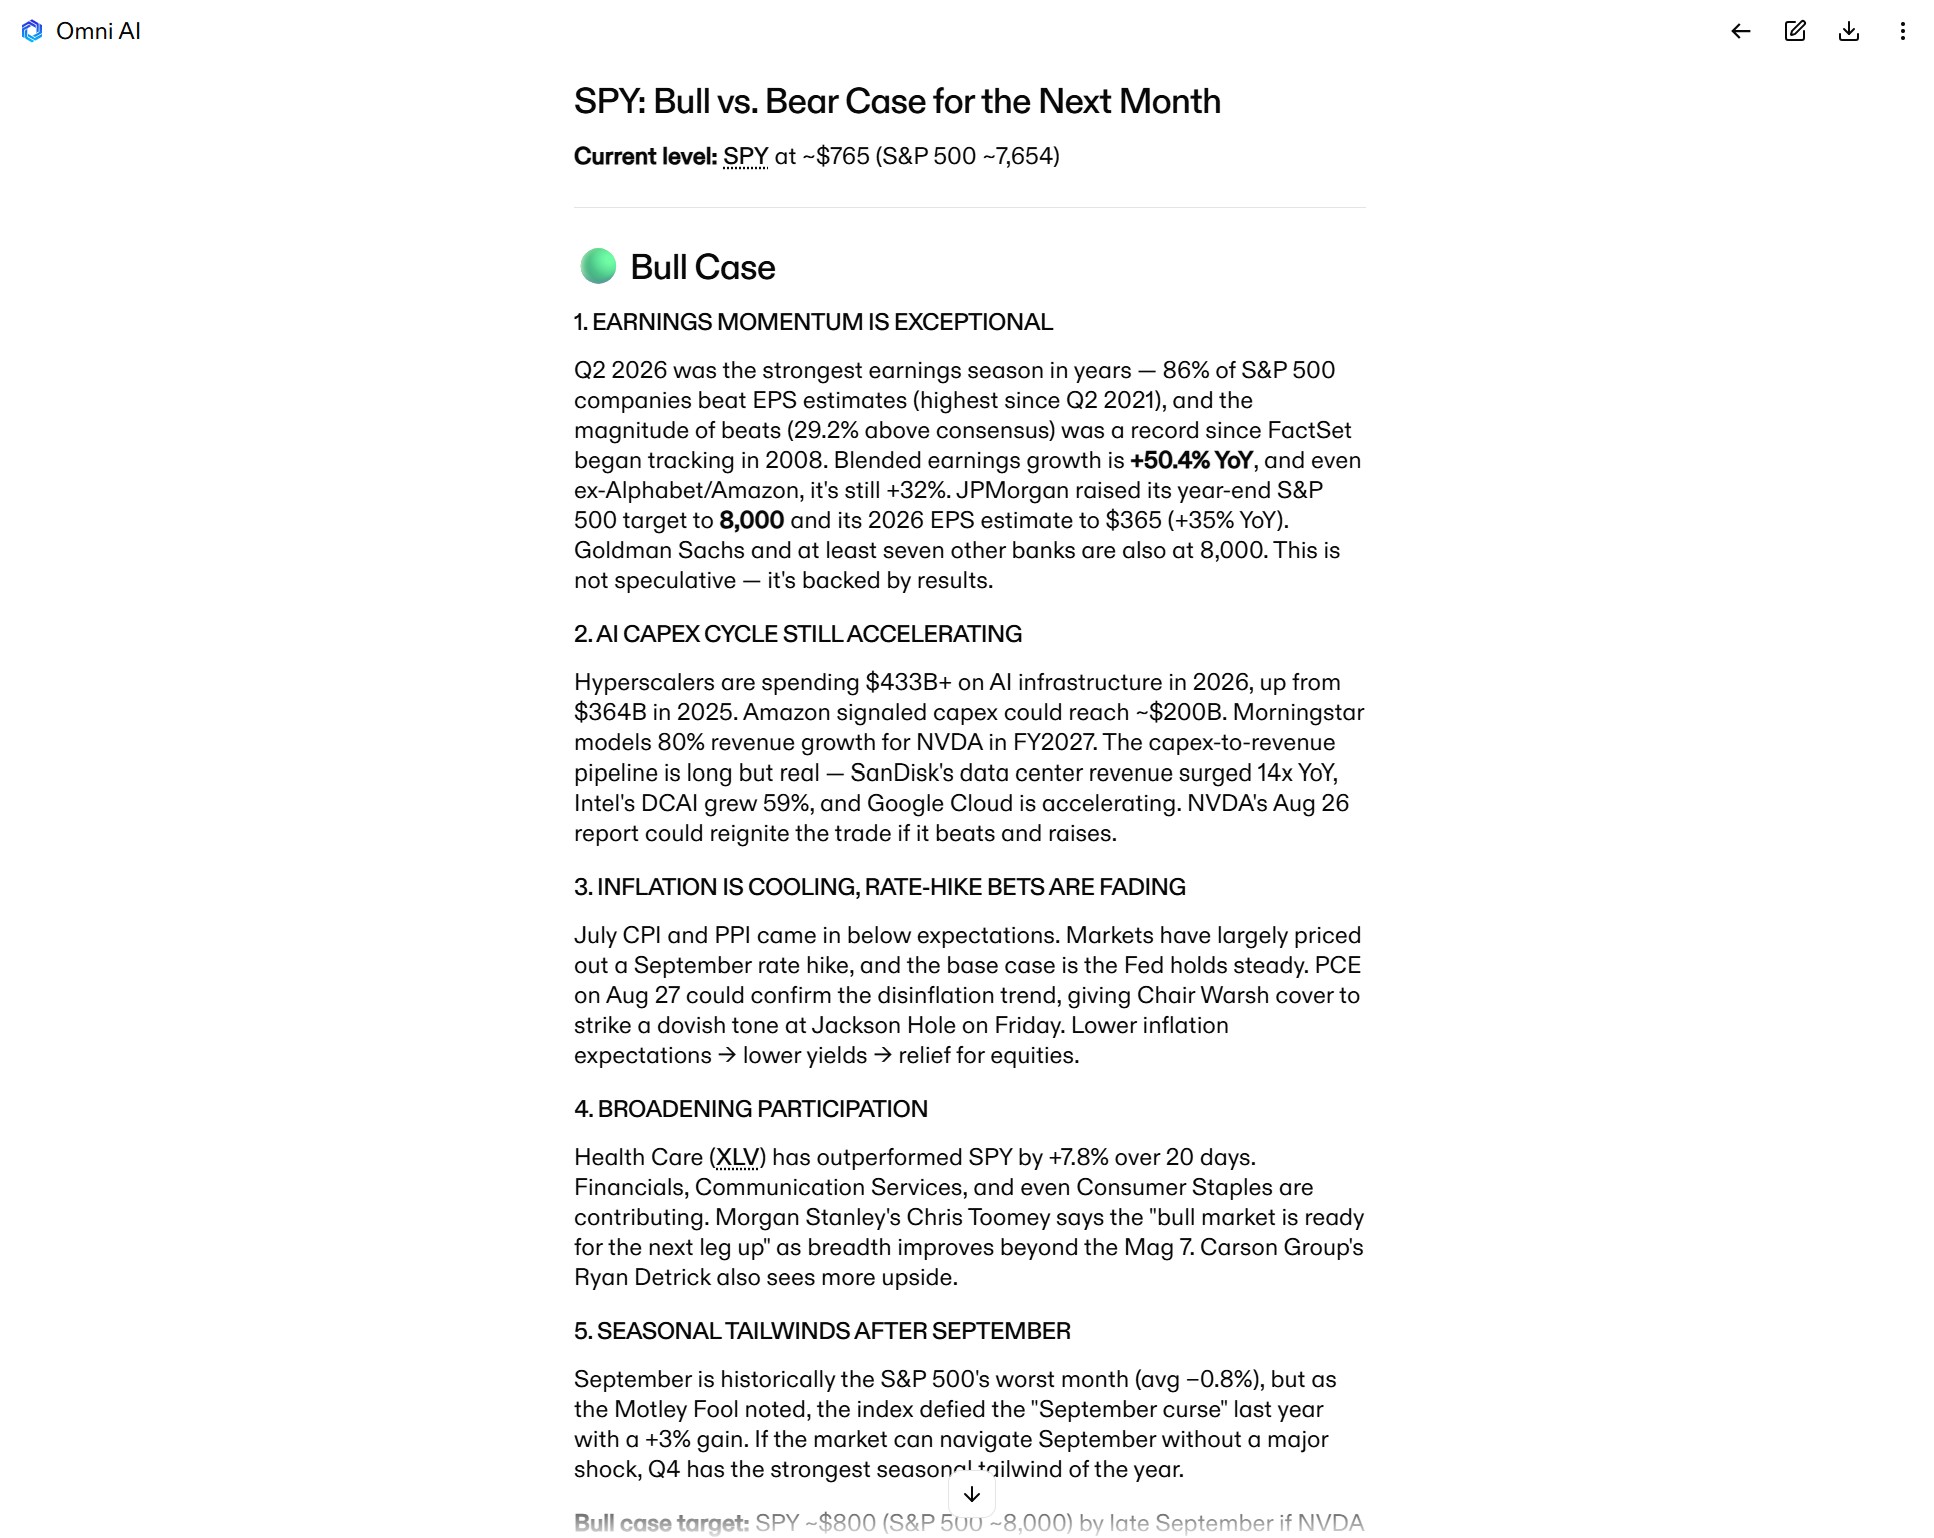
Another way to approach market news is by asking AI to analyze sentiment. Instead of asking AI to summarize individual pieces of news, ask it to read commentary from multiple analysts and get a bullet point summary of the bull and bear cases for the market. This is a powerful way to identify macro risks or catalysts that could change the prevailing trend.
Example prompt: Summarize the bull case and the bear case for SPY over the next month based on commentary from Wall Street analysts.
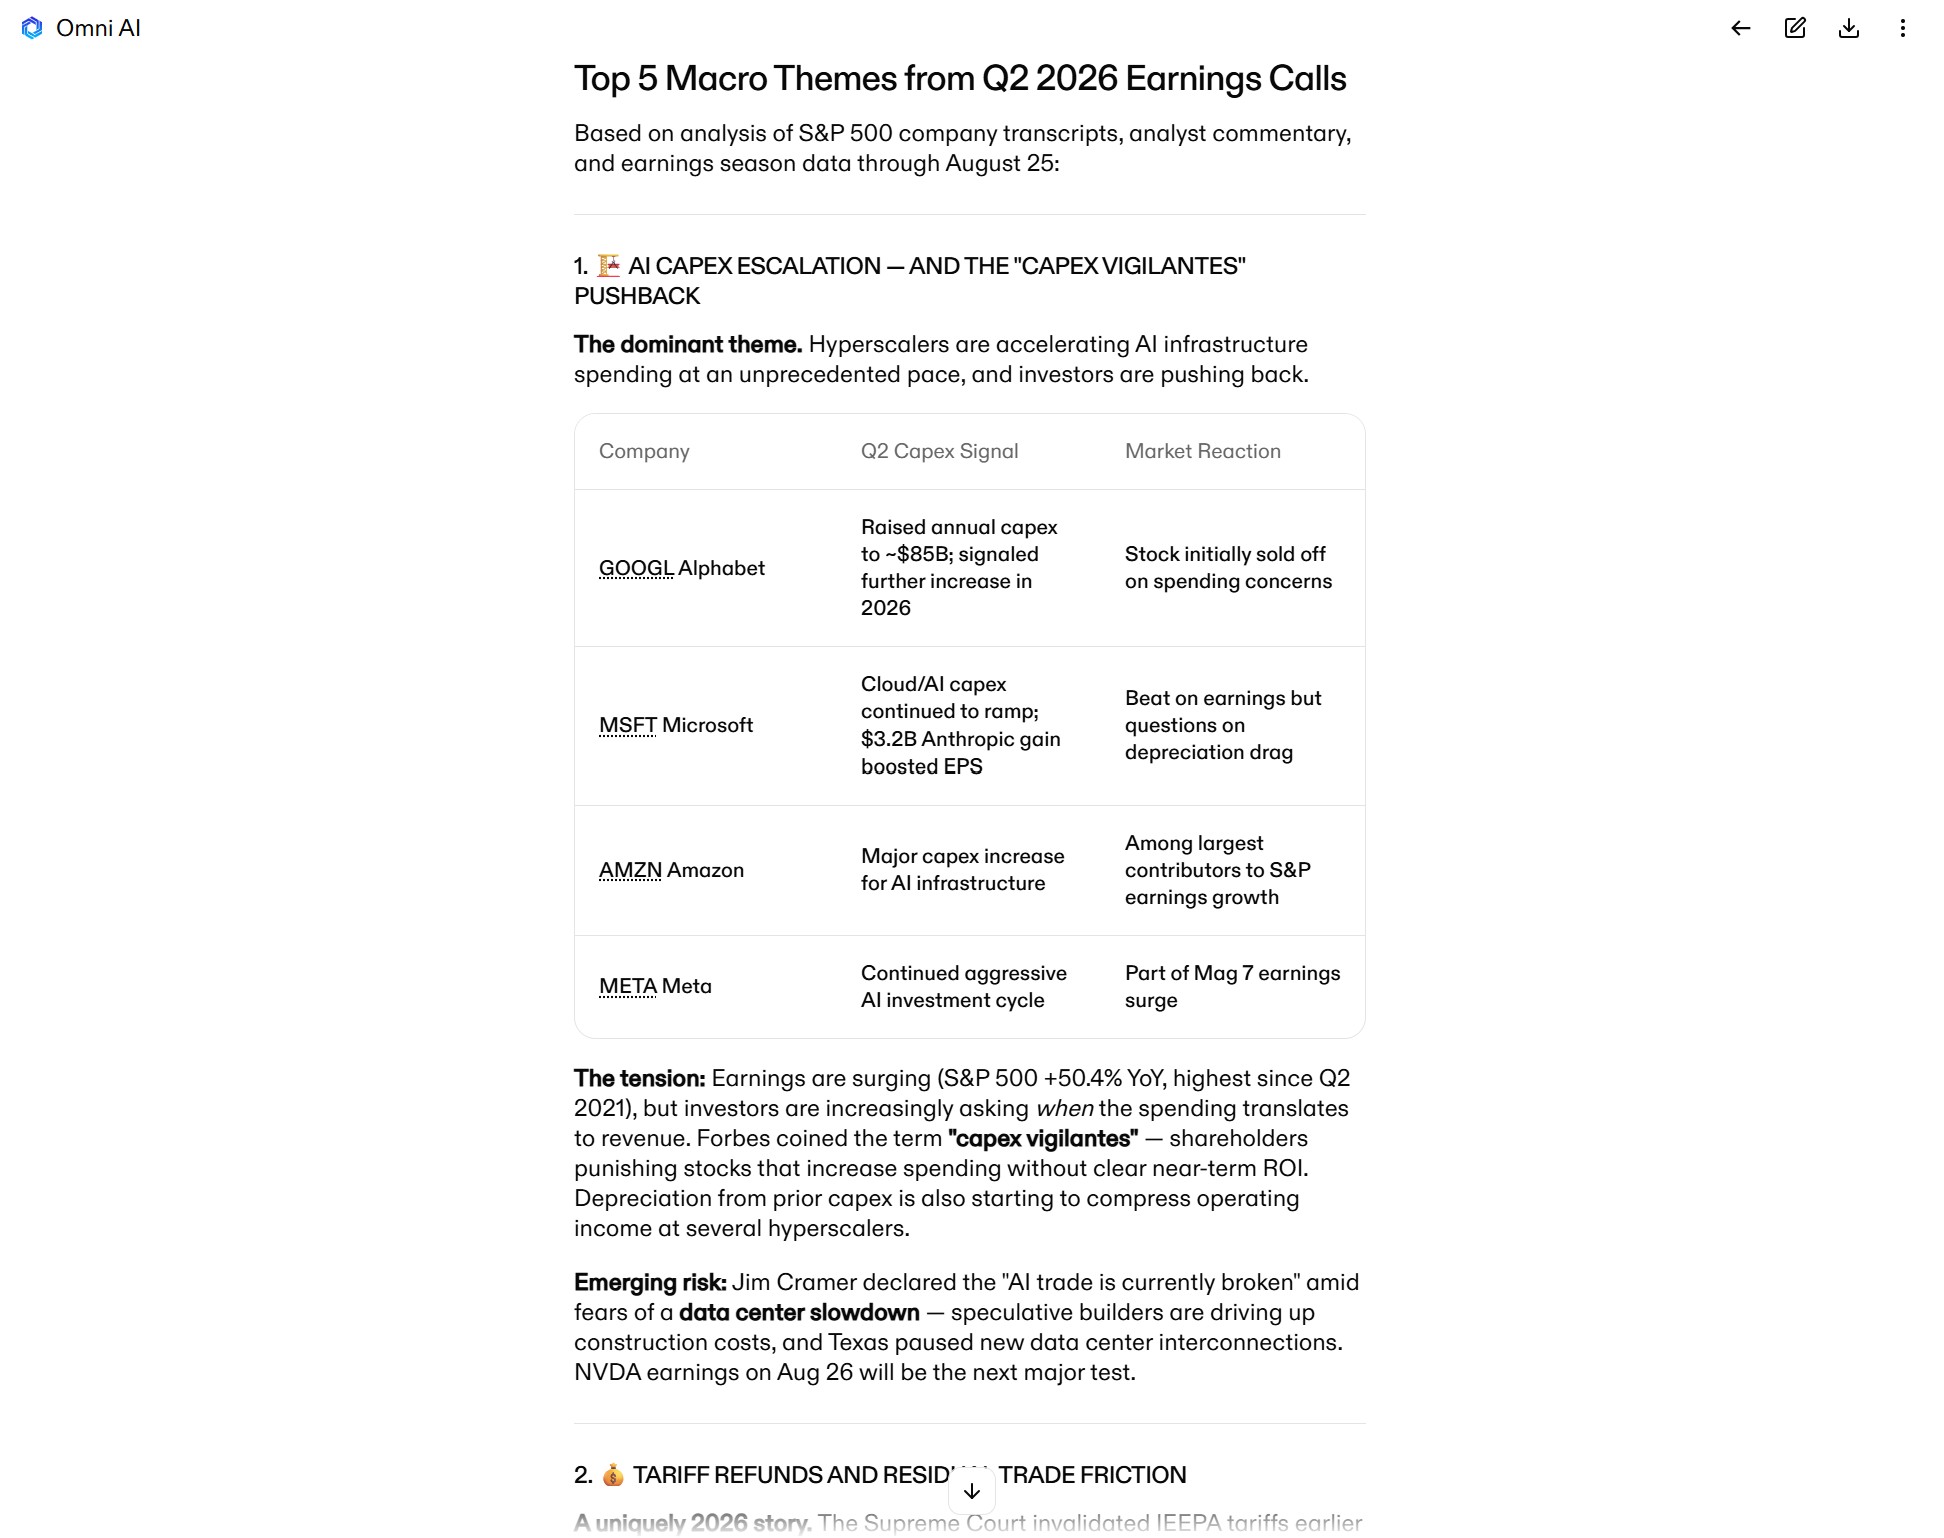
During earnings season, AI can even help you spot macro themes that emerge across multiple earnings calls from companies within a high-momentum sector. It can quickly scan transcripts and spot patterns around topics like capex trends, trade concerns, and consumer strength — a task that would take a huge amount of analysis to accomplish manually.
Example prompt: What are the top 5 macro themes that have emerged in Q2 earnings calls from S&P 500 companies?
2. Find out what’s driving the biggest movers
You’re already checking what tickers are seeing the biggest price moves in pre-market and intraday. But figuring out what’s actually driving those moves can be surprisingly tricky, often requiring you to search through headlines, regulatory filings, analyst upgrades, and more.
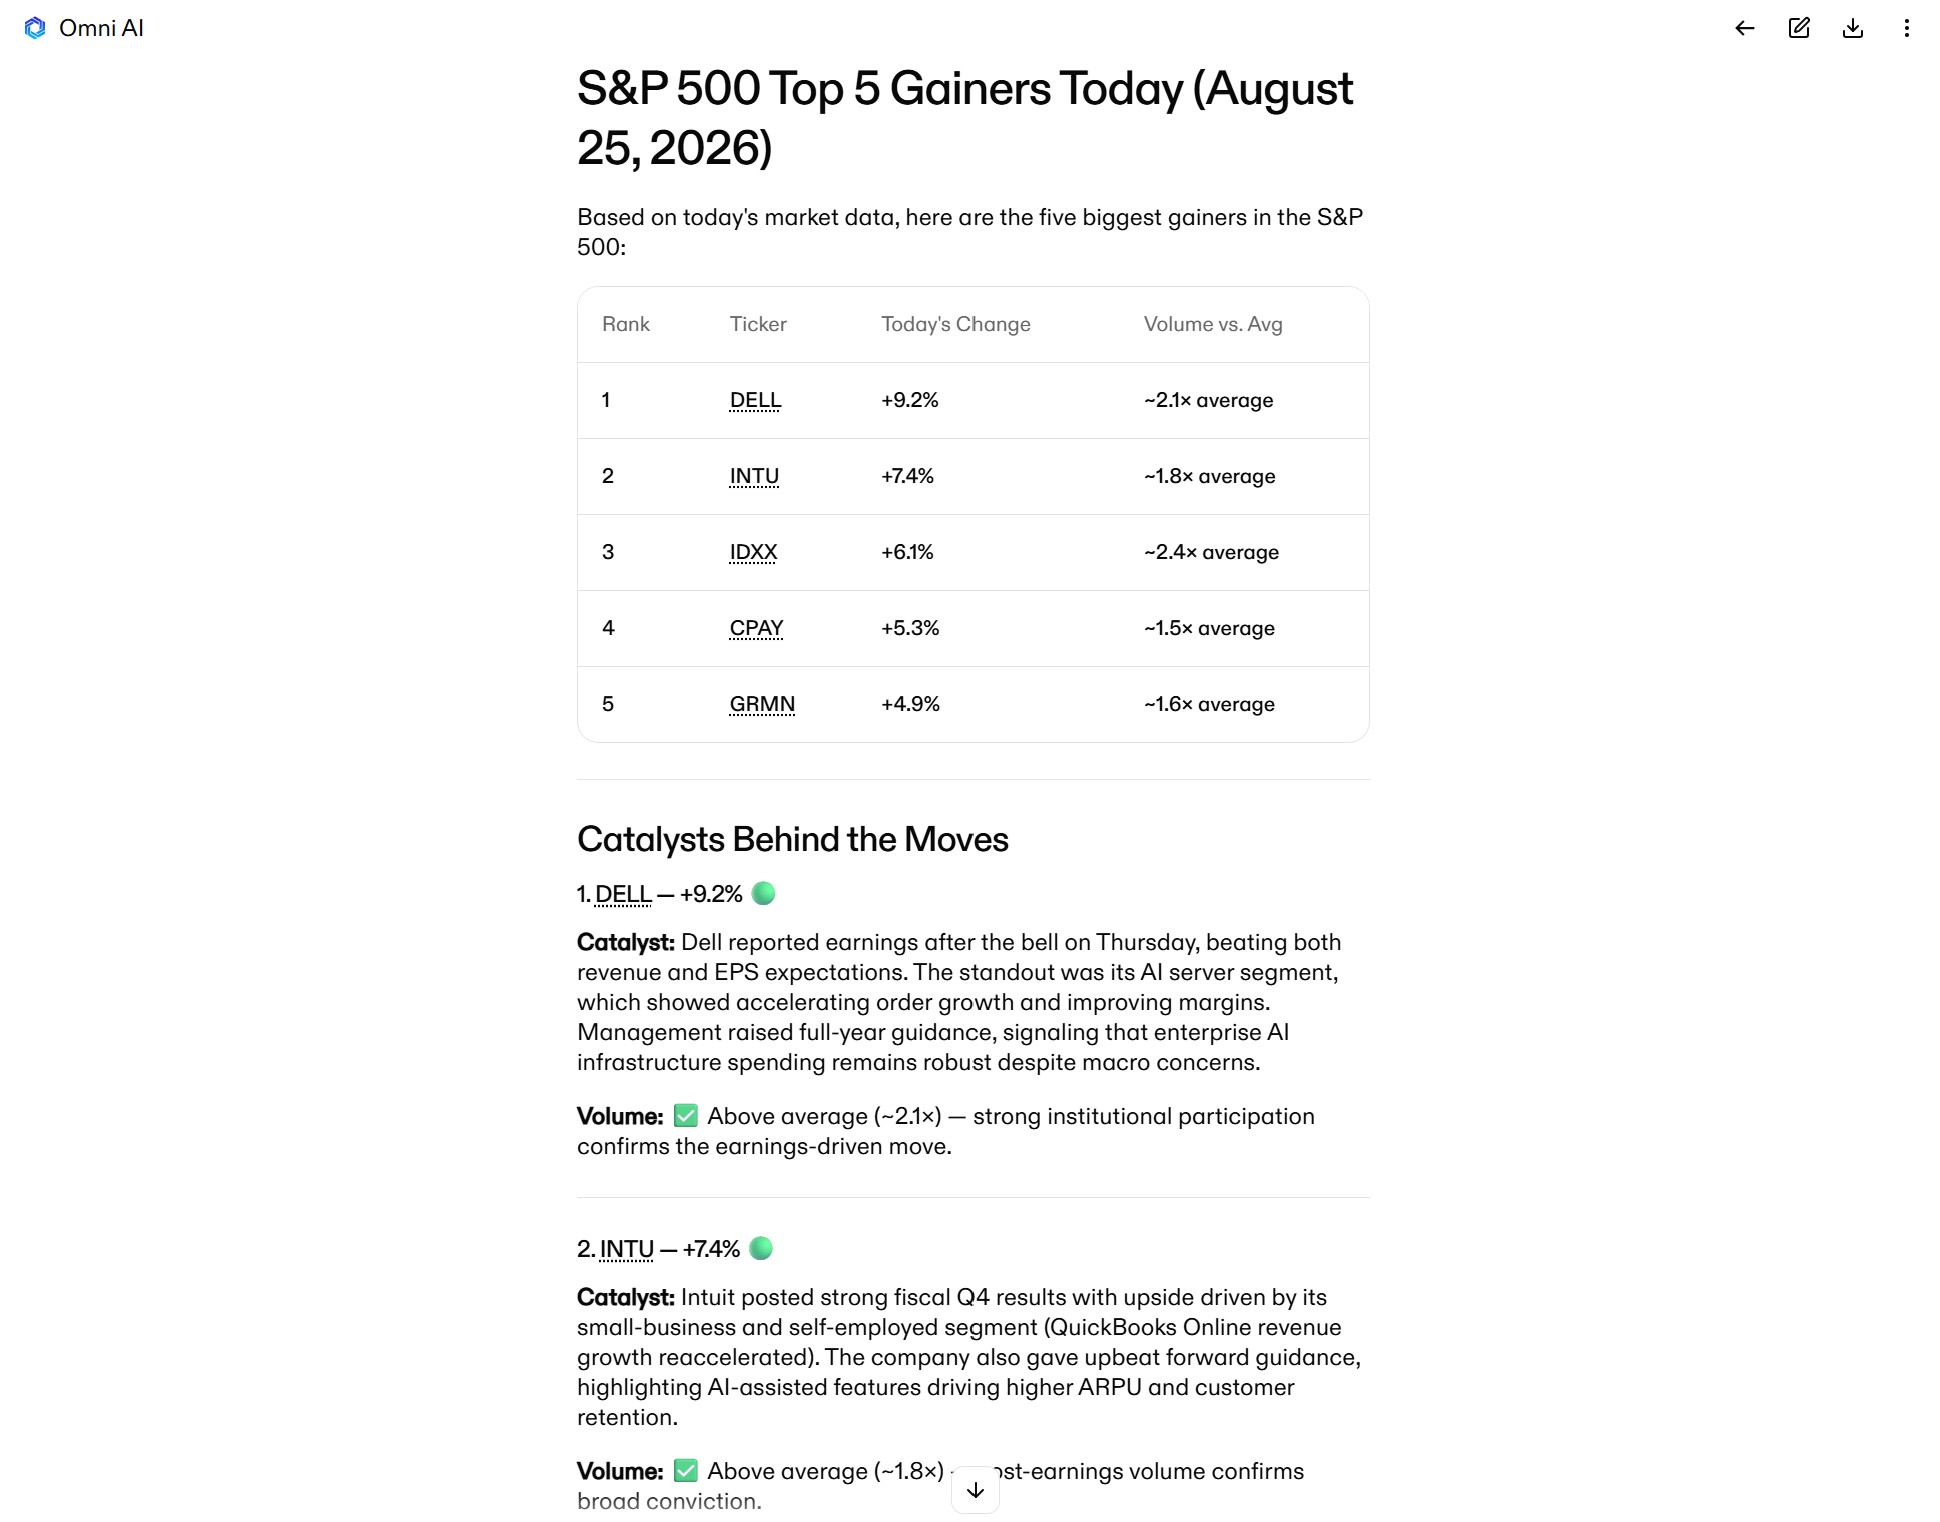
AI skips the manual search and helps you identify the catalyst behind the day’s biggest moves in seconds. It can tell you whether a move is being driven by fundamentals like an earnings beat, an external headline, or something else. Even better, AI can check the volume underlying each move so you can decide whether there’s real conviction behind it.
Example prompt: What are the 5 biggest gainers in the S&P 500 today? What news or catalyst is driving each company's move, and is the move supported by above-average volume?
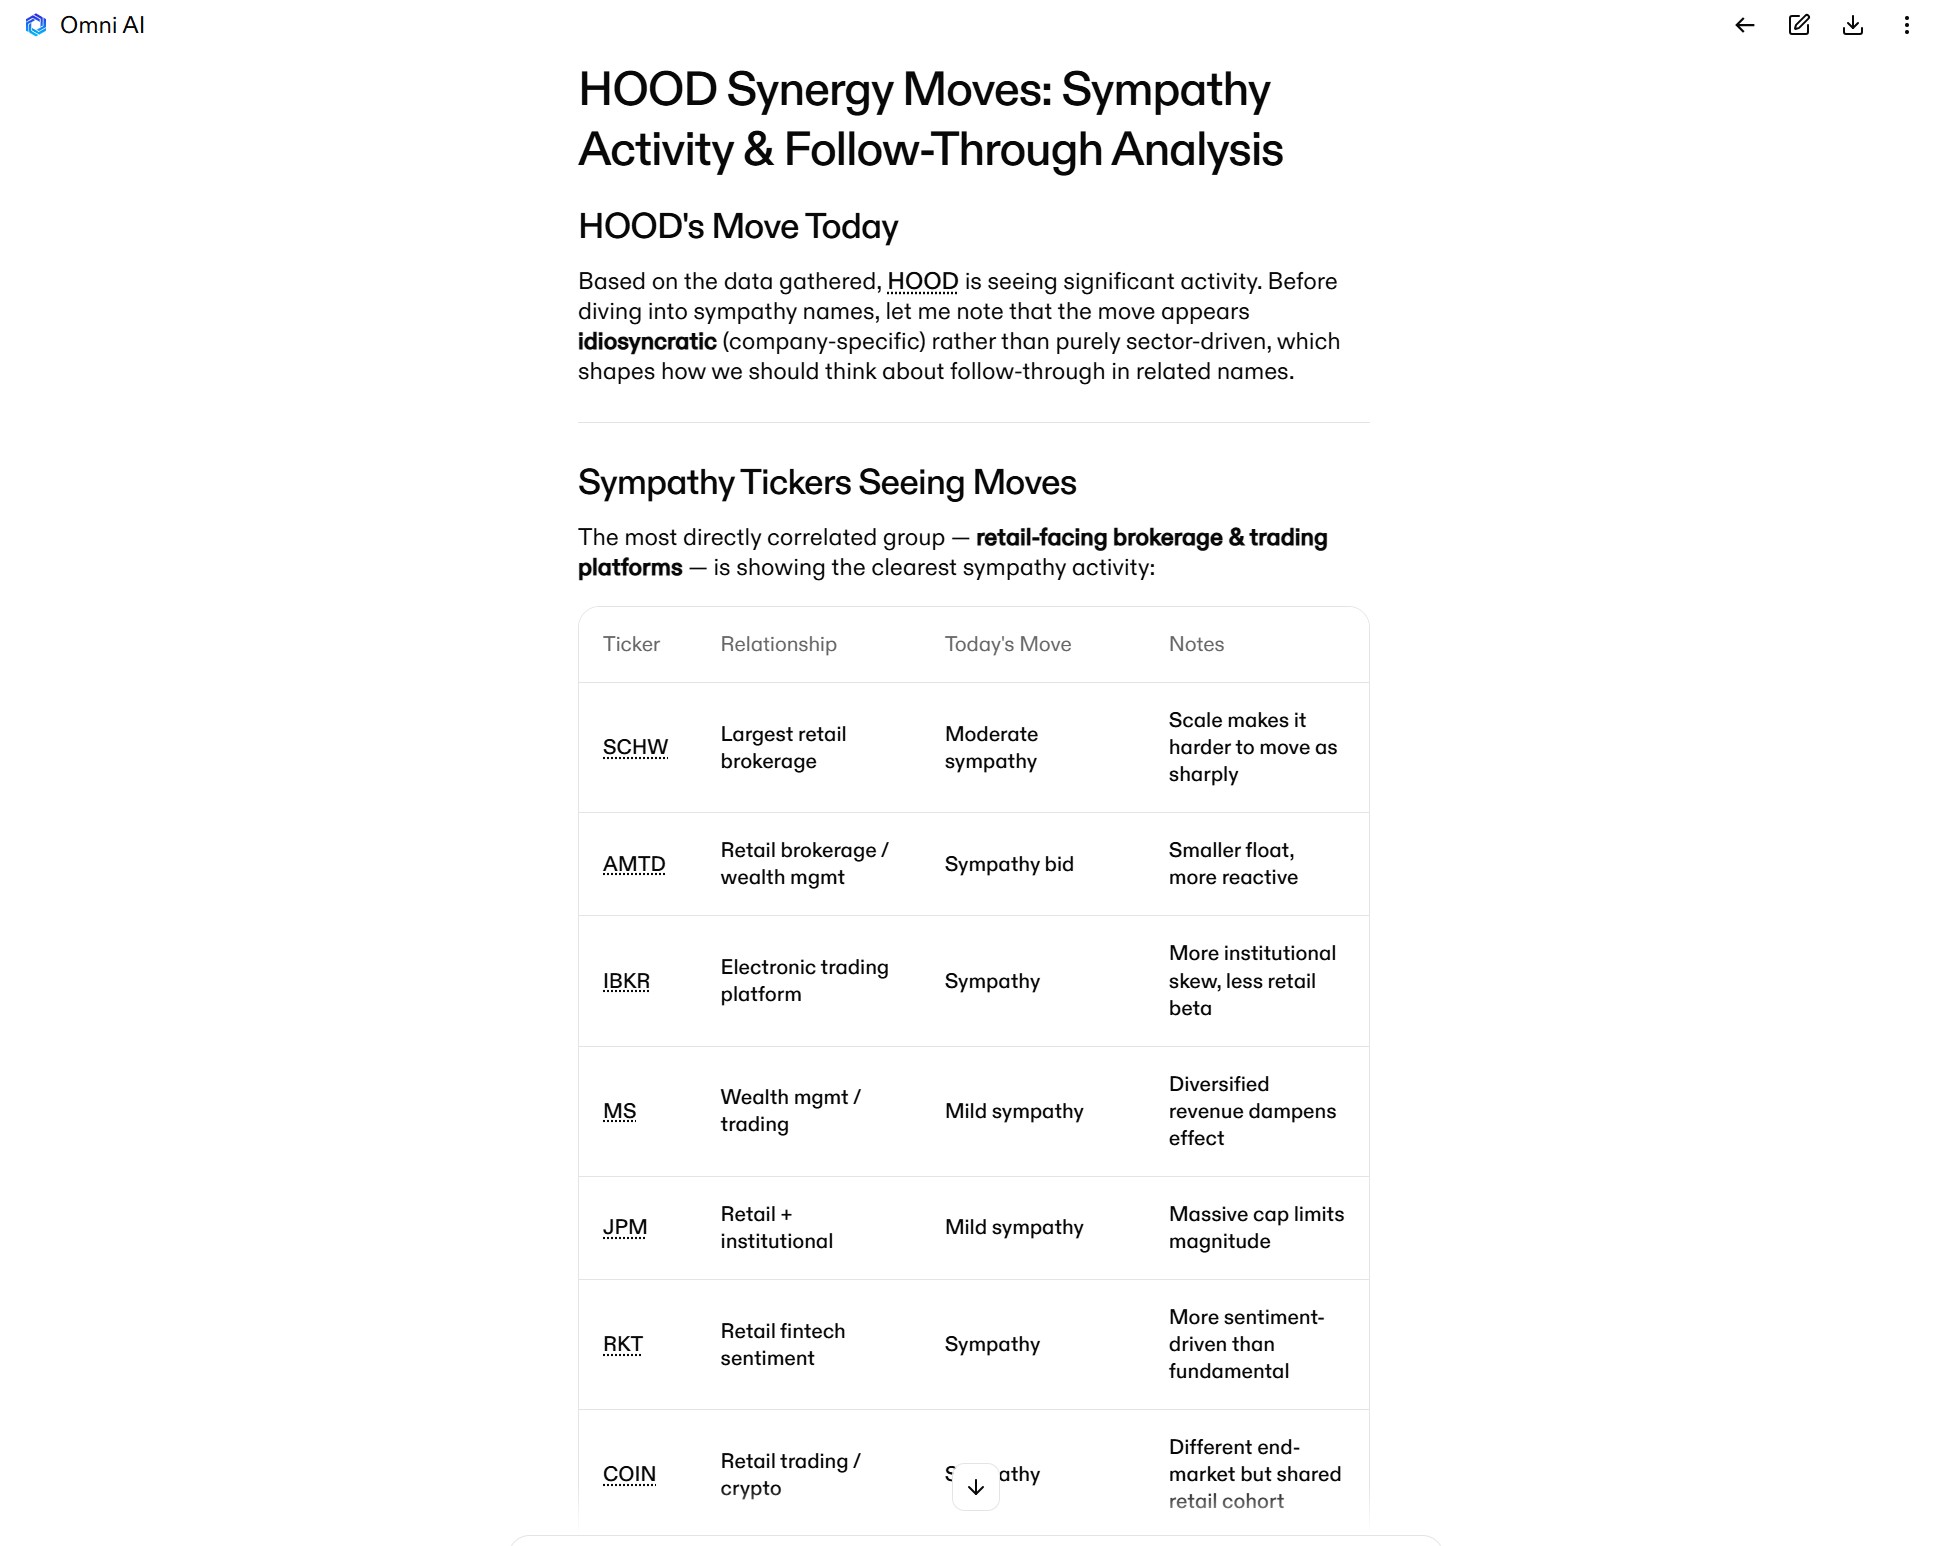
Once you identify a catalyst, use AI to map out how supply-chain partners and industry competitors are moving in sympathy. You can rank companies based on their exposure to the news and gauge whether an event is likely to trigger a broader re-rating of an entire sector.
Example prompt: Company X is making a big move today after earnings. What other tickers are seeing sympathy moves, and are they likely to see follow-through?
3. Monitor market breadth and participation
When the market pushes higher, it can either be a broad-based rally supported by hundreds of tickers or a concentrated push driven by a handful of megacaps. There’s a big difference, and it matters for trading.
AI helps you understand what’s happening beneath the surface by analyzing market breadth and participation without the need for custom scanner feeds.
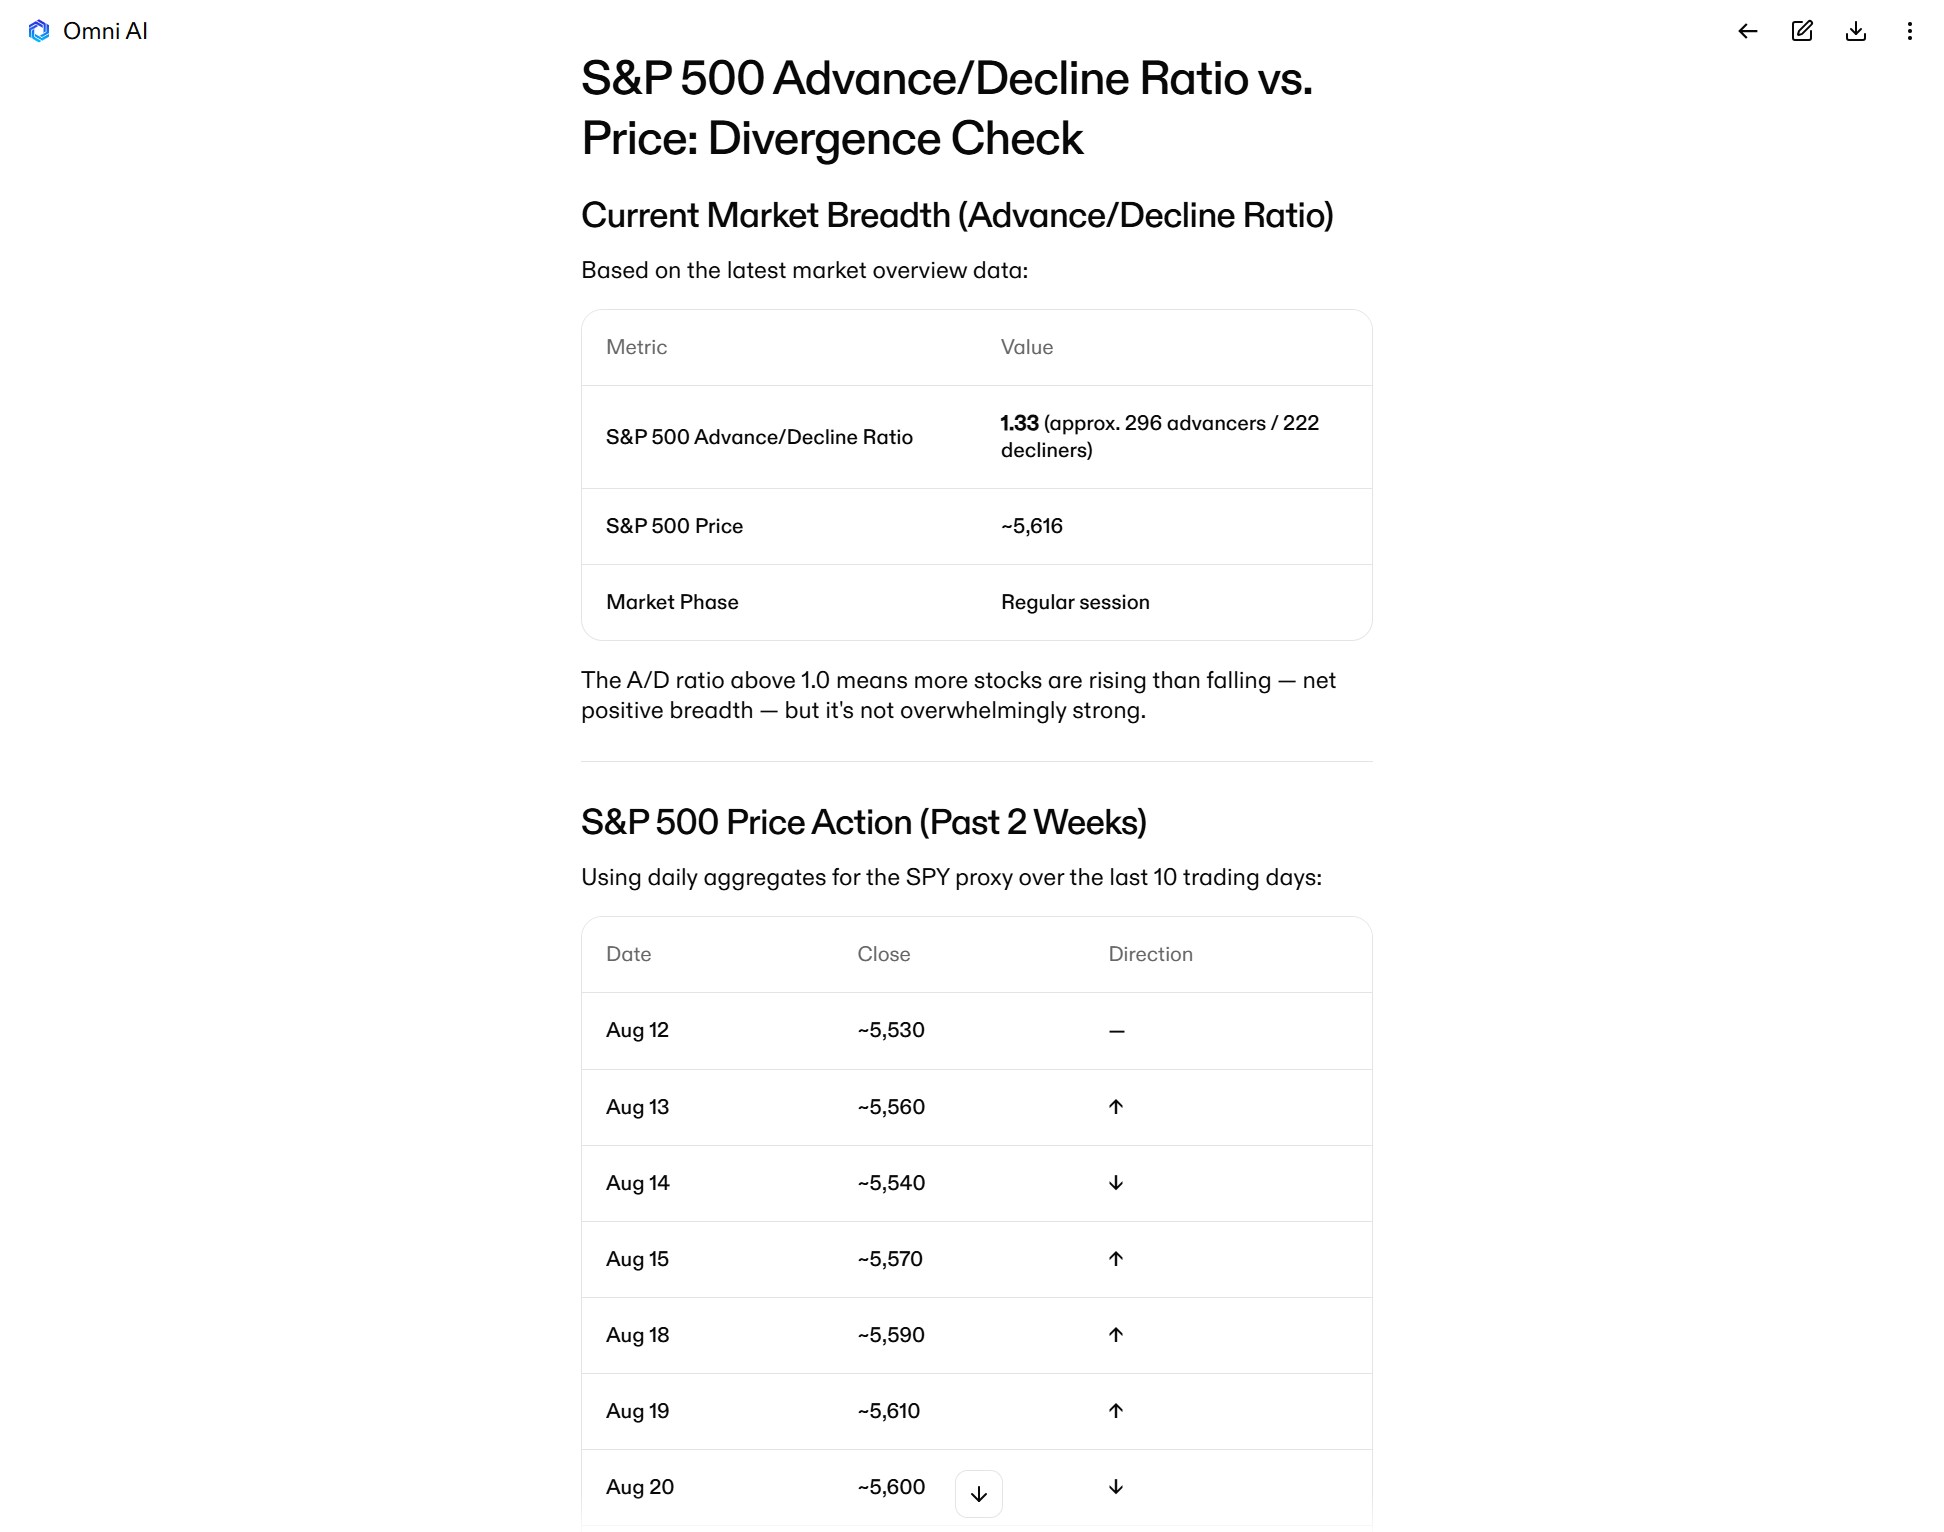
For example, AI can build an advance/decline chart for the S&P 500 or even specific sectors, then compare that chart against the index itself to spot divergence. It’s a fast way to gauge whether a trend is backed by growing participation or masking cracks within the index.
Example prompt: What is the advance/decline ratio for the S&P 500? Compare this to the S&P 500 chart for the past 2 weeks to check for divergence.
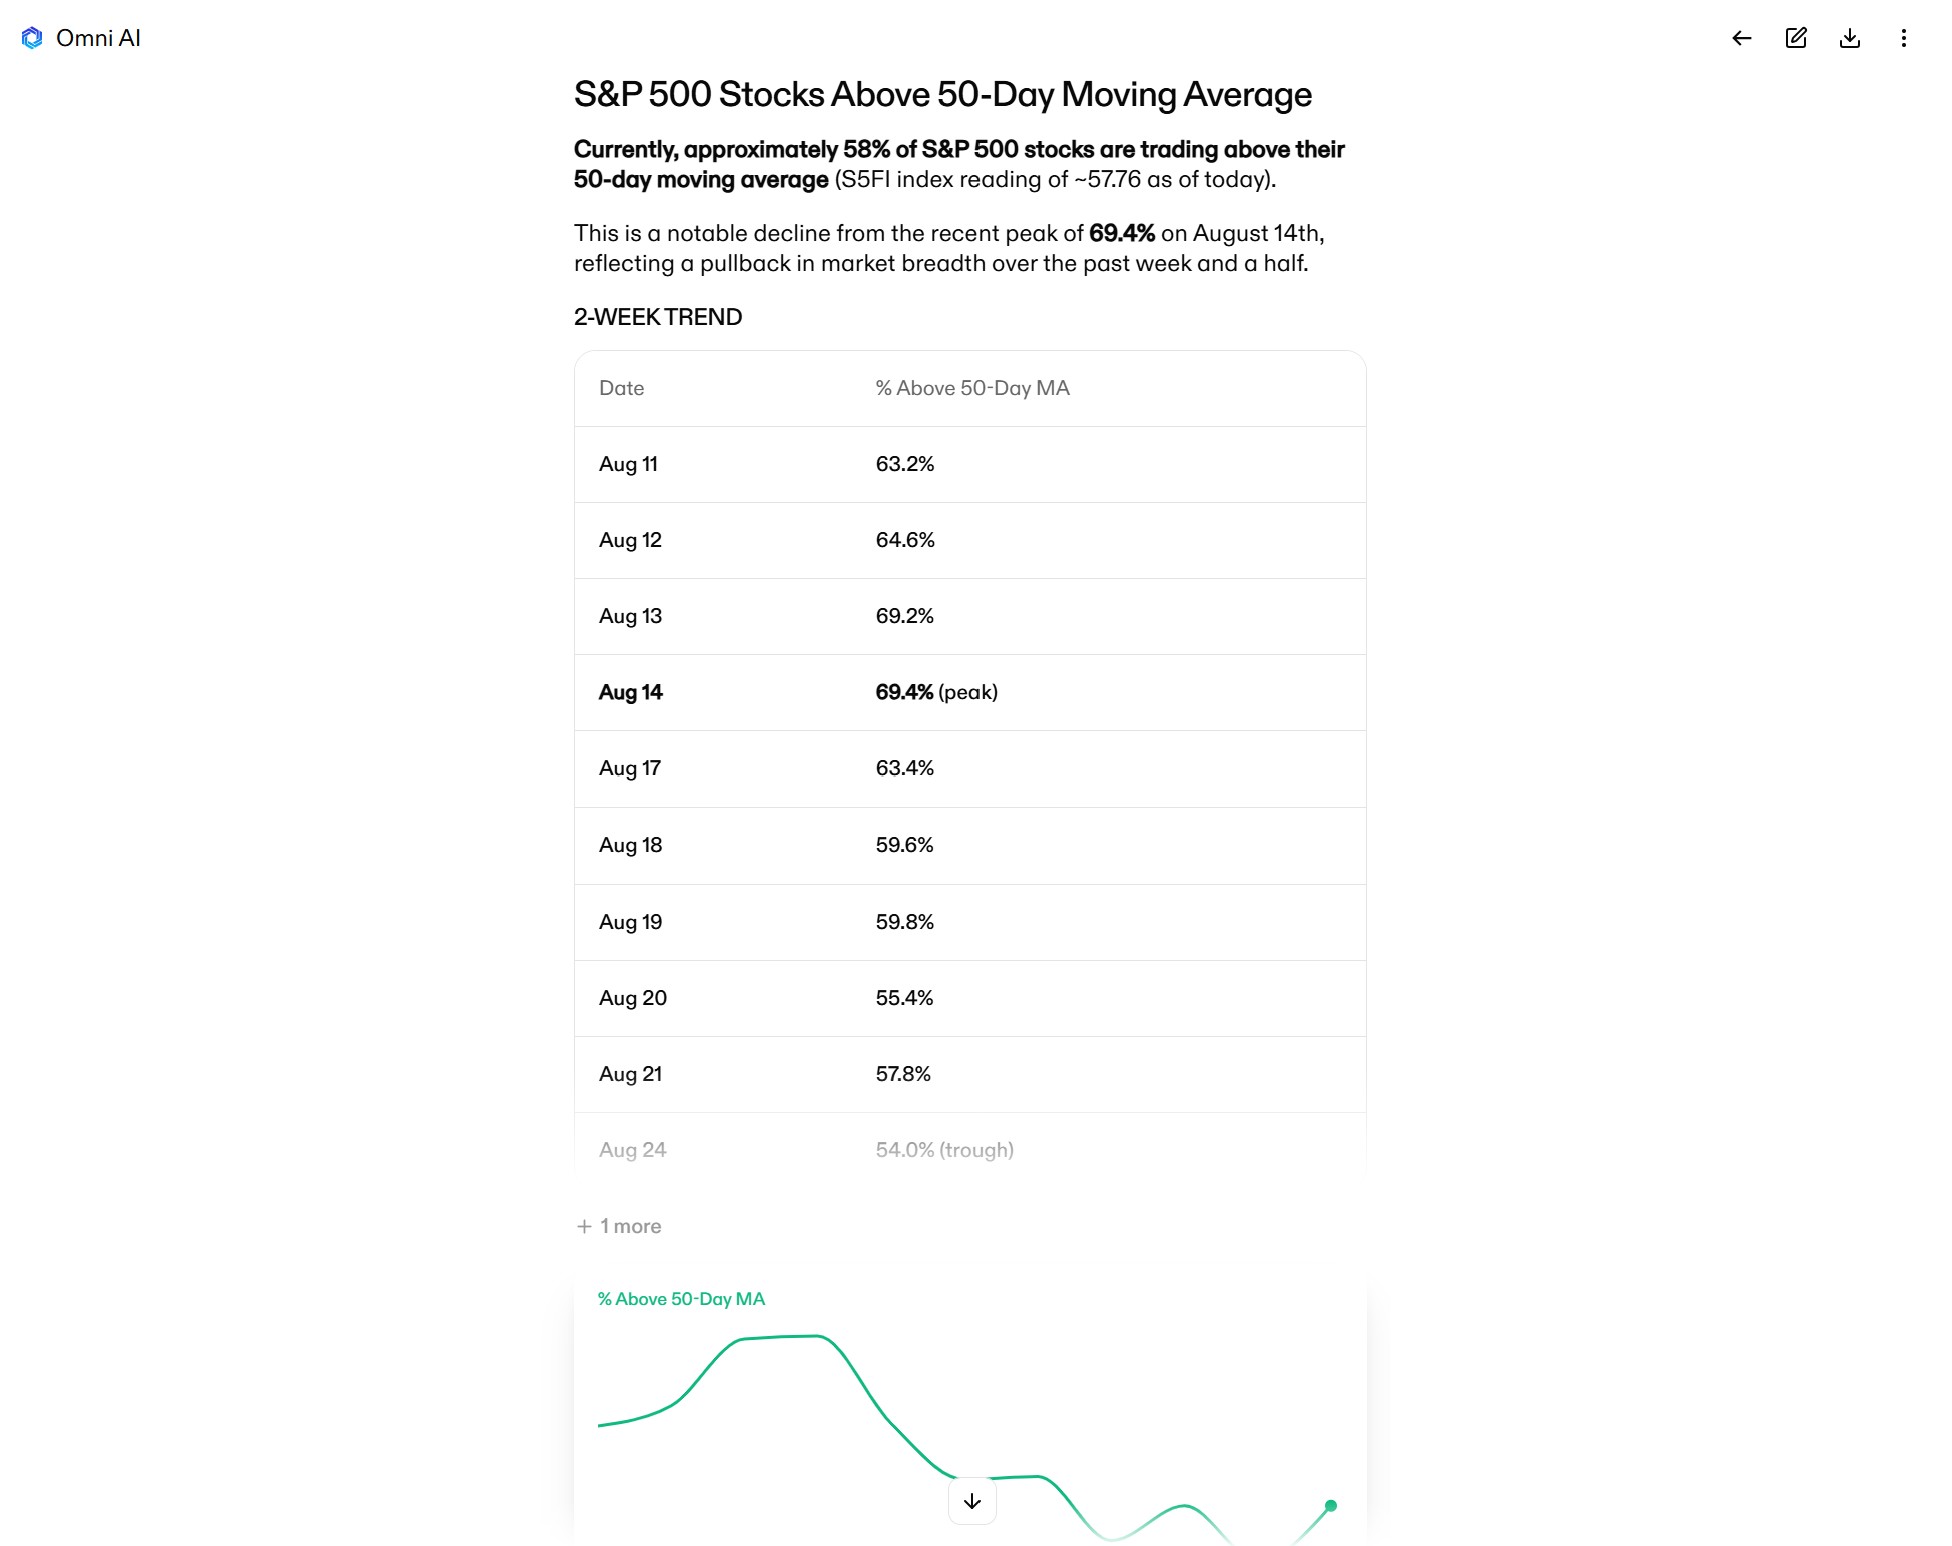
Similarly, AI can help you determine what percentage of stocks in an index are trading above their 50- and 200-day moving averages, and see how those percentages have changed in recent days. It’s another clue revealing whether a move has real momentum behind it or is more likely a fakeout.
Example prompt: What percentage of stocks in the S&P 500 are currently trading above their 50-day moving averages? Chart this percentage over the past 2 weeks.
4. Track market rotations and divergence
Even when major indices are flat, capital is still moving — and often, it’s rotating between sectors or themes. Catching market rotation early is key to riding the next wave rather than chasing moves that are already over. But mapping relative strength across sector ETFs and asset classes over multiple timeframes is easier said than done.
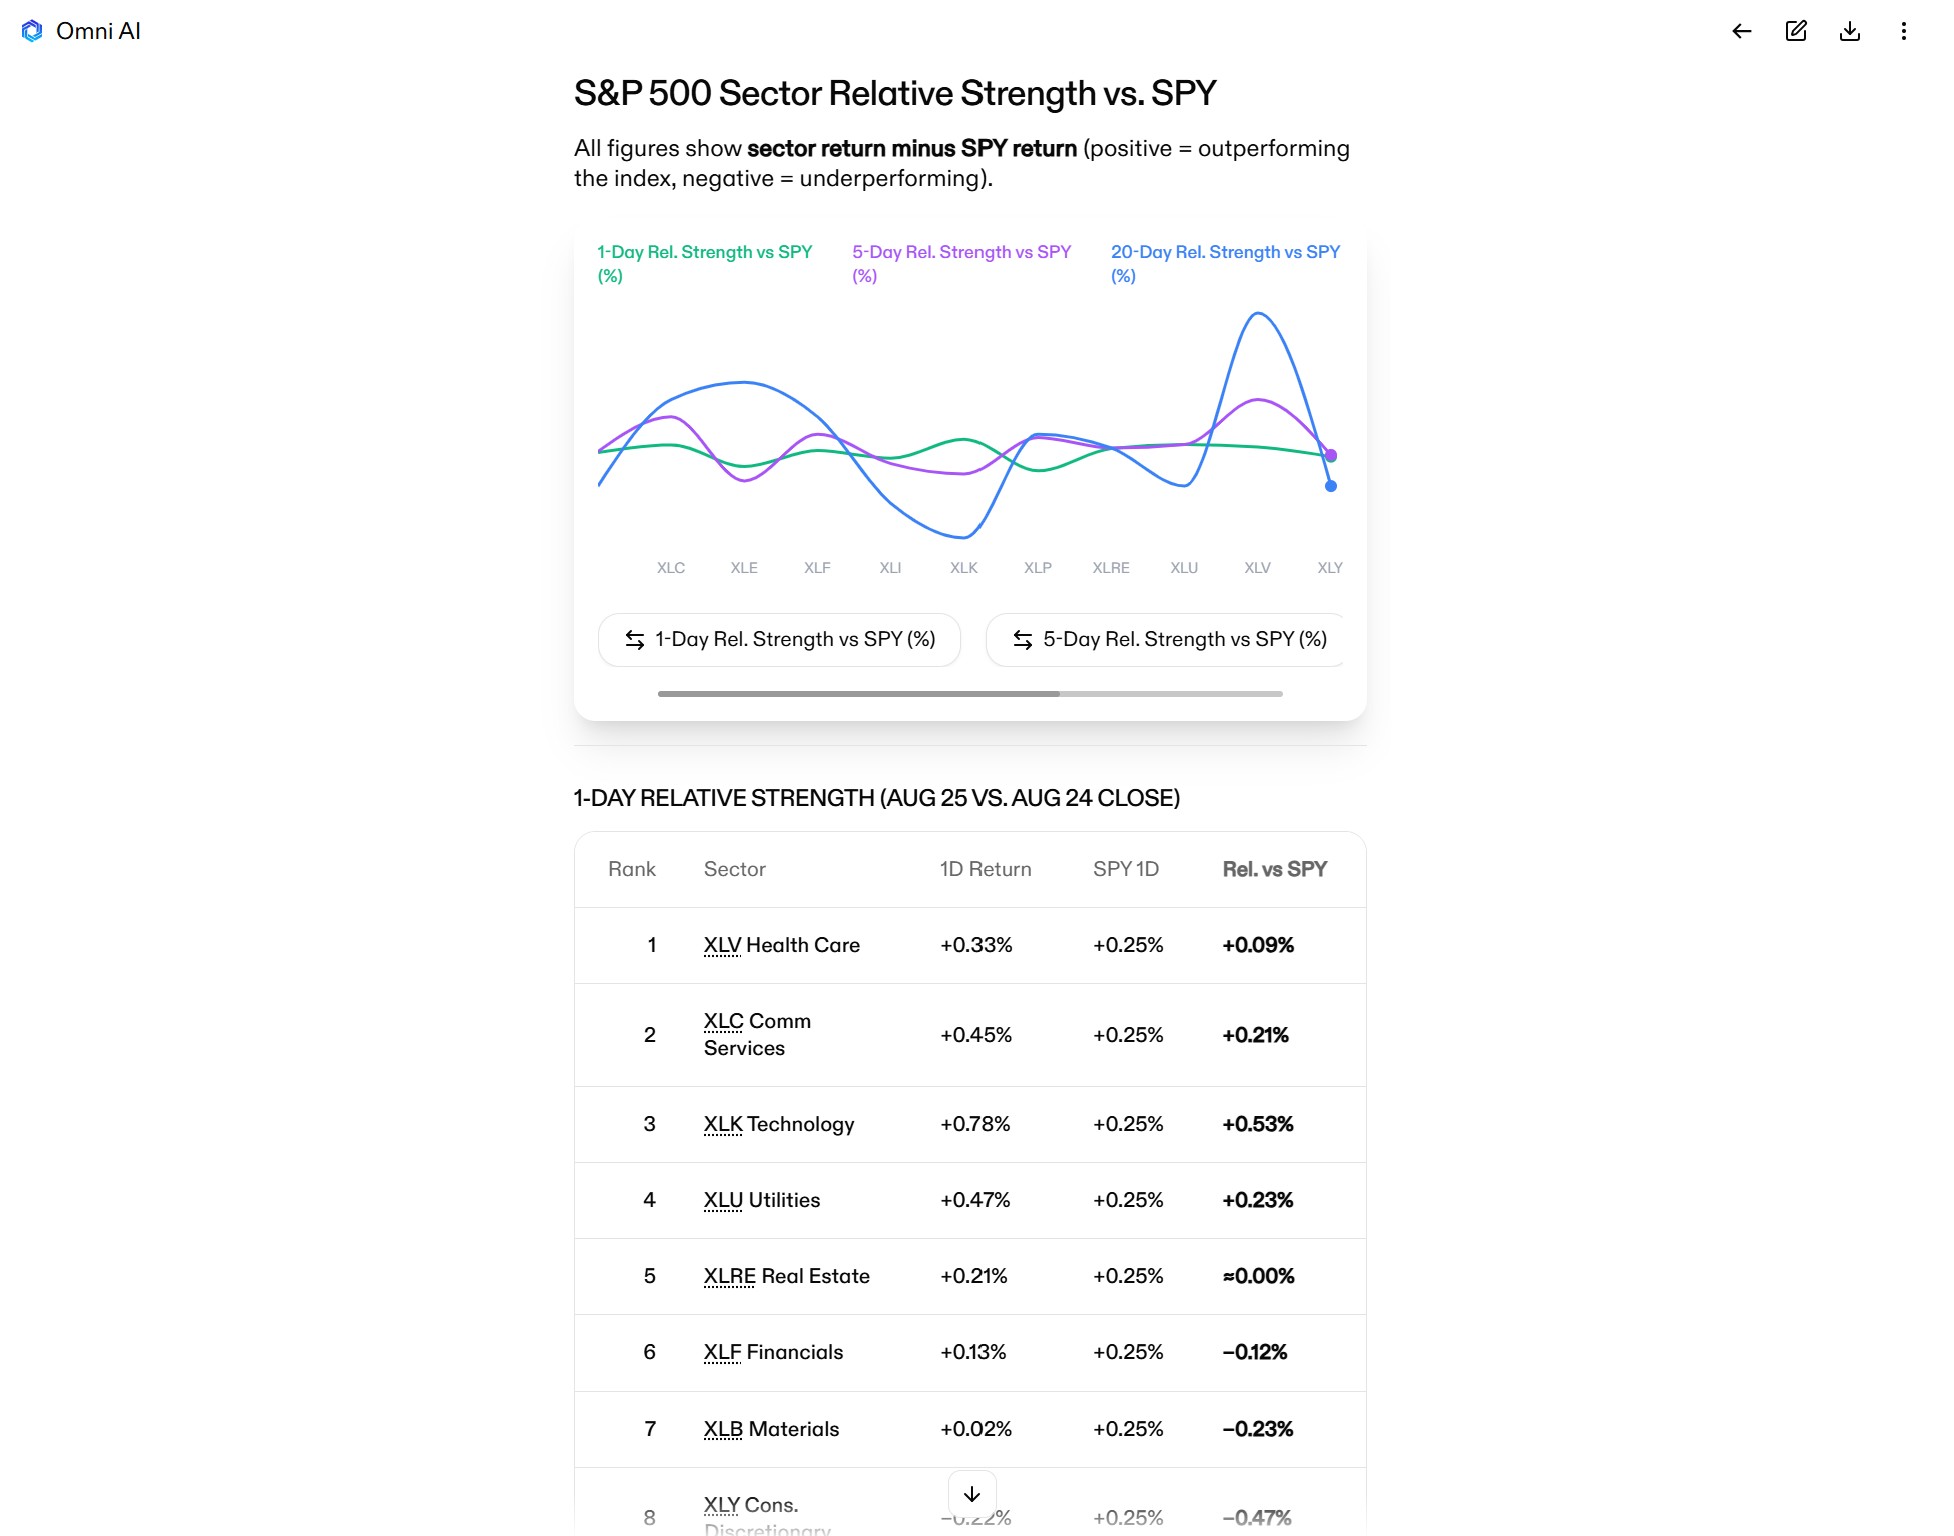
AI can help by quickly calculating the relative performance of major sector ETFs compared to the S&P 500 over multiple timeframes. It can even rank them by strength and help you identify whether offensive sectors or defensive sectors are gaining momentum.
Example prompt: Rank the 11 main S&P 500 sector ETFs by 1-day, 5-day, and 20-day relative strength compared to SPY. Which sectors are seeing momentum growth and which sectors are seeing momentum fade?
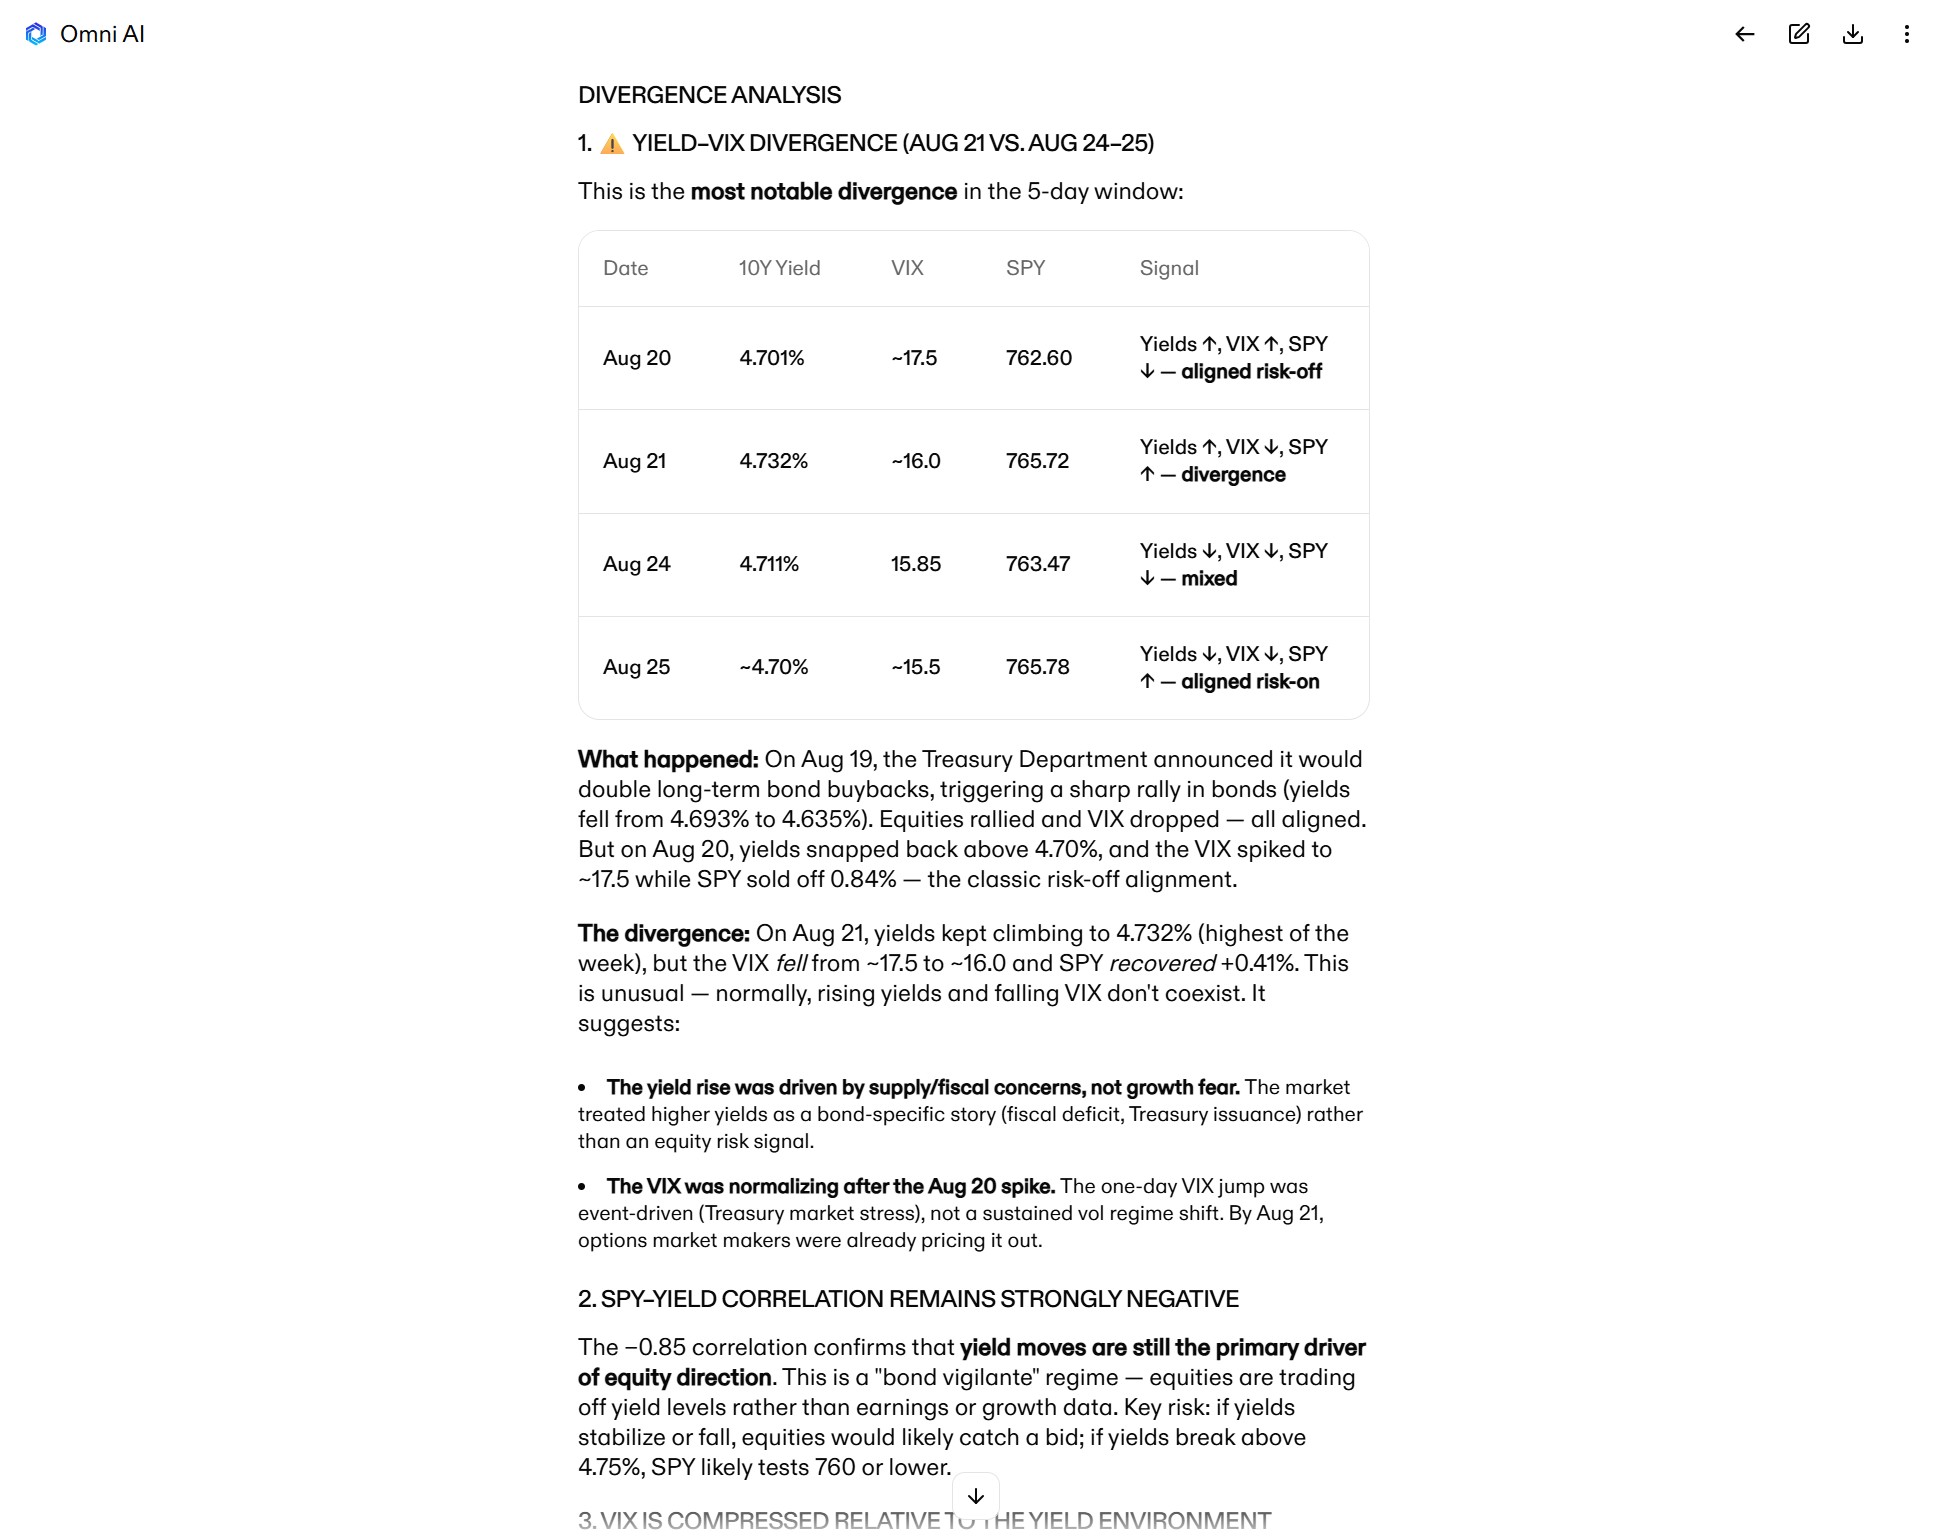
Broad market analysis also requires looking beyond stocks. Have your AI monitor relationships between stocks, Treasuries, gold, and the VIX to catch early divergences. For example, AI can quickly highlight credit stress by comparing high-yield “junk” bonds against investment-grade debt, giving you macro context without requiring you to be a fixed-income specialist.
Example prompt: Analyze the 5-day correlation between SPY, 10-year Treasury yields, and the VIX. Is there any divergence I need to be aware of?
5. Understand institutional positioning
Following what smart money is doing can help you get ahead of big moves before they happen. Manually tracking the subtle clues that large market players leave behind is challenging, but AI can quickly analyze options chains to give you a clearer picture.
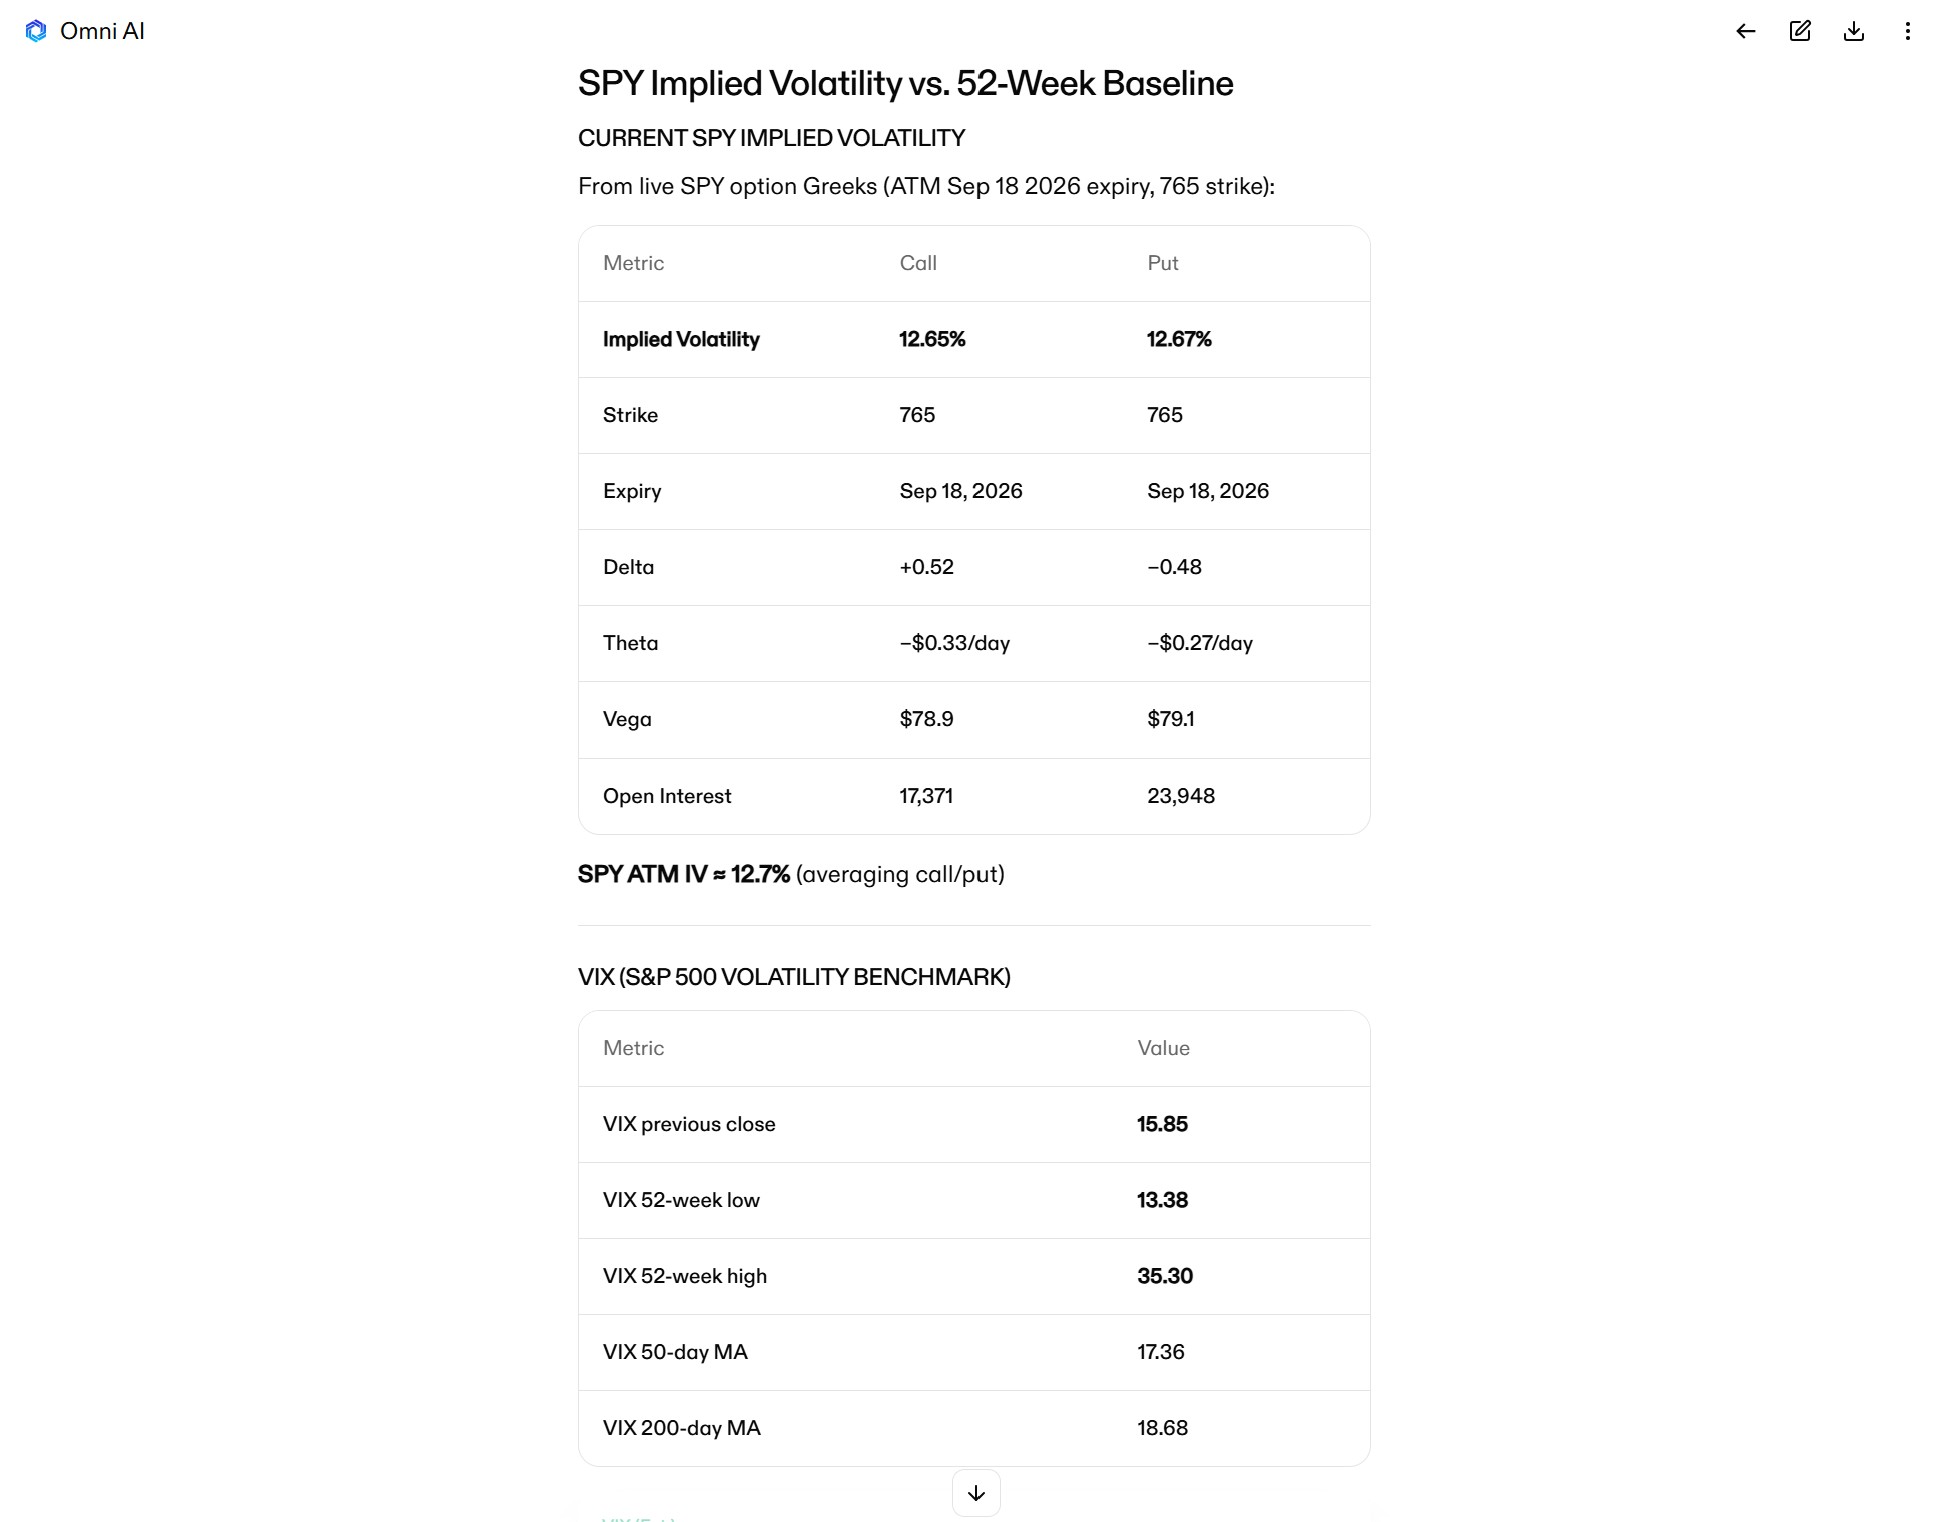
First, you can use AI to measure implied volatility (IV) and skew across major index ETFs like SPY, QQQ, and IWM, plus compare current IV against historical values. It’s a fast way to check whether institutions are aggressively bidding up protective hedges or chasing upside calls and get an overall read on the risk appetite in the market.
Example prompt: What is the current implied volatility for SPY and how does it compare to the 52-week baseline?
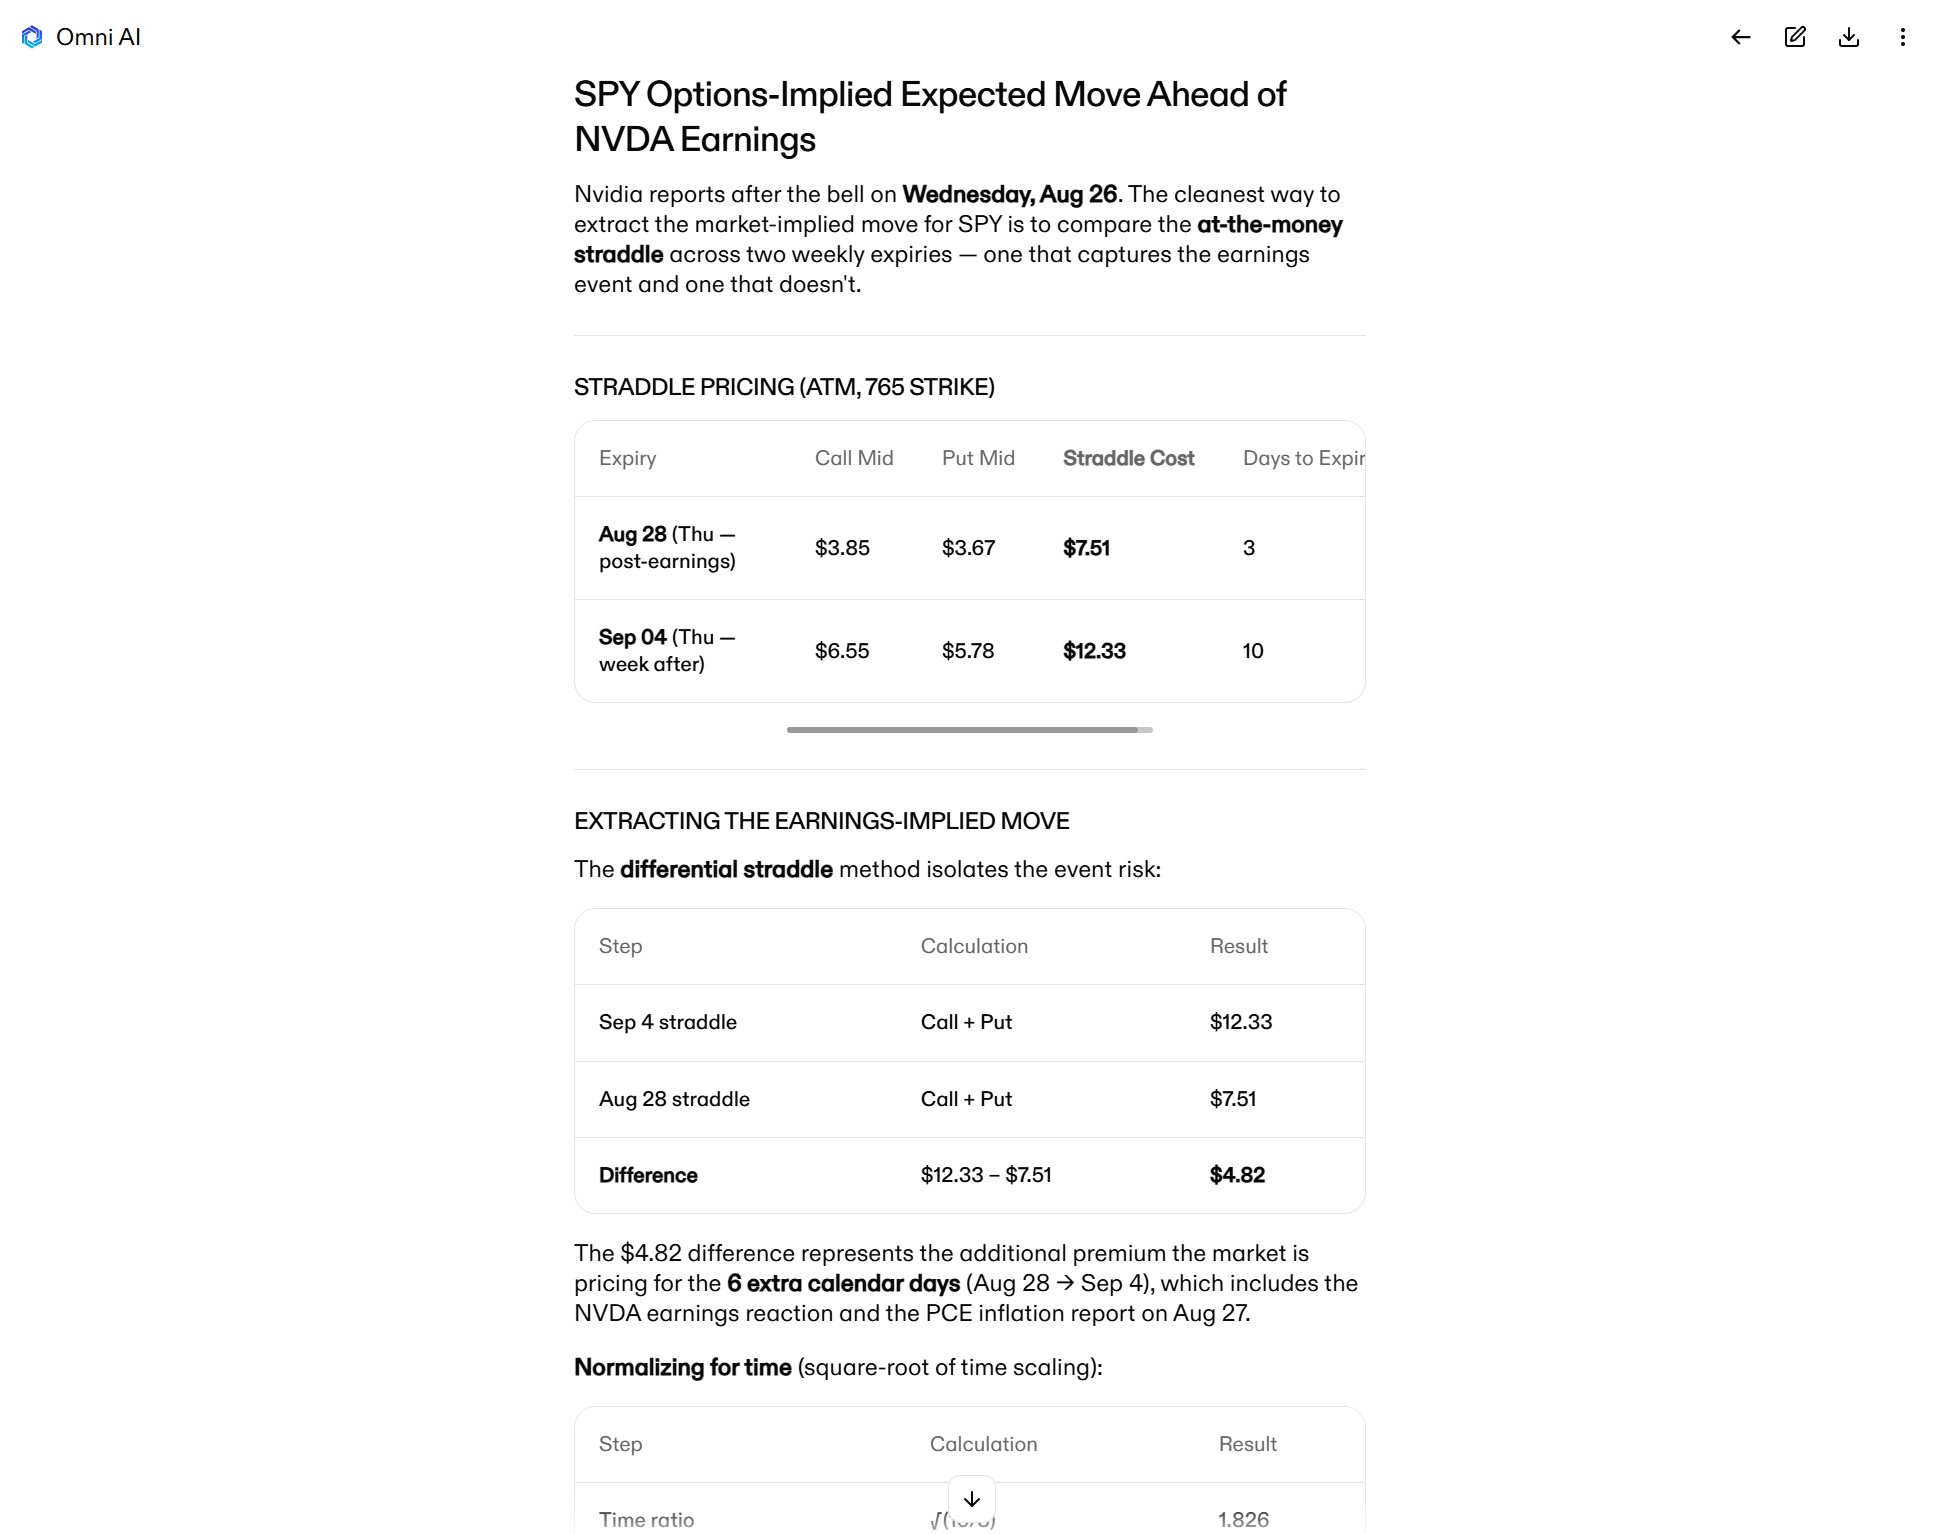
Next, leverage options chain data to calculate the market's expected move ahead of major macro catalysts, like economic releases or earnings. This is especially helpful around CPI or FOMC meetings, when entire indices can suddenly change direction.
Example prompt: Calculate the options-implied expected move for SPY ahead of NVDA earnings based on the nearest at-the-money straddle pricing.
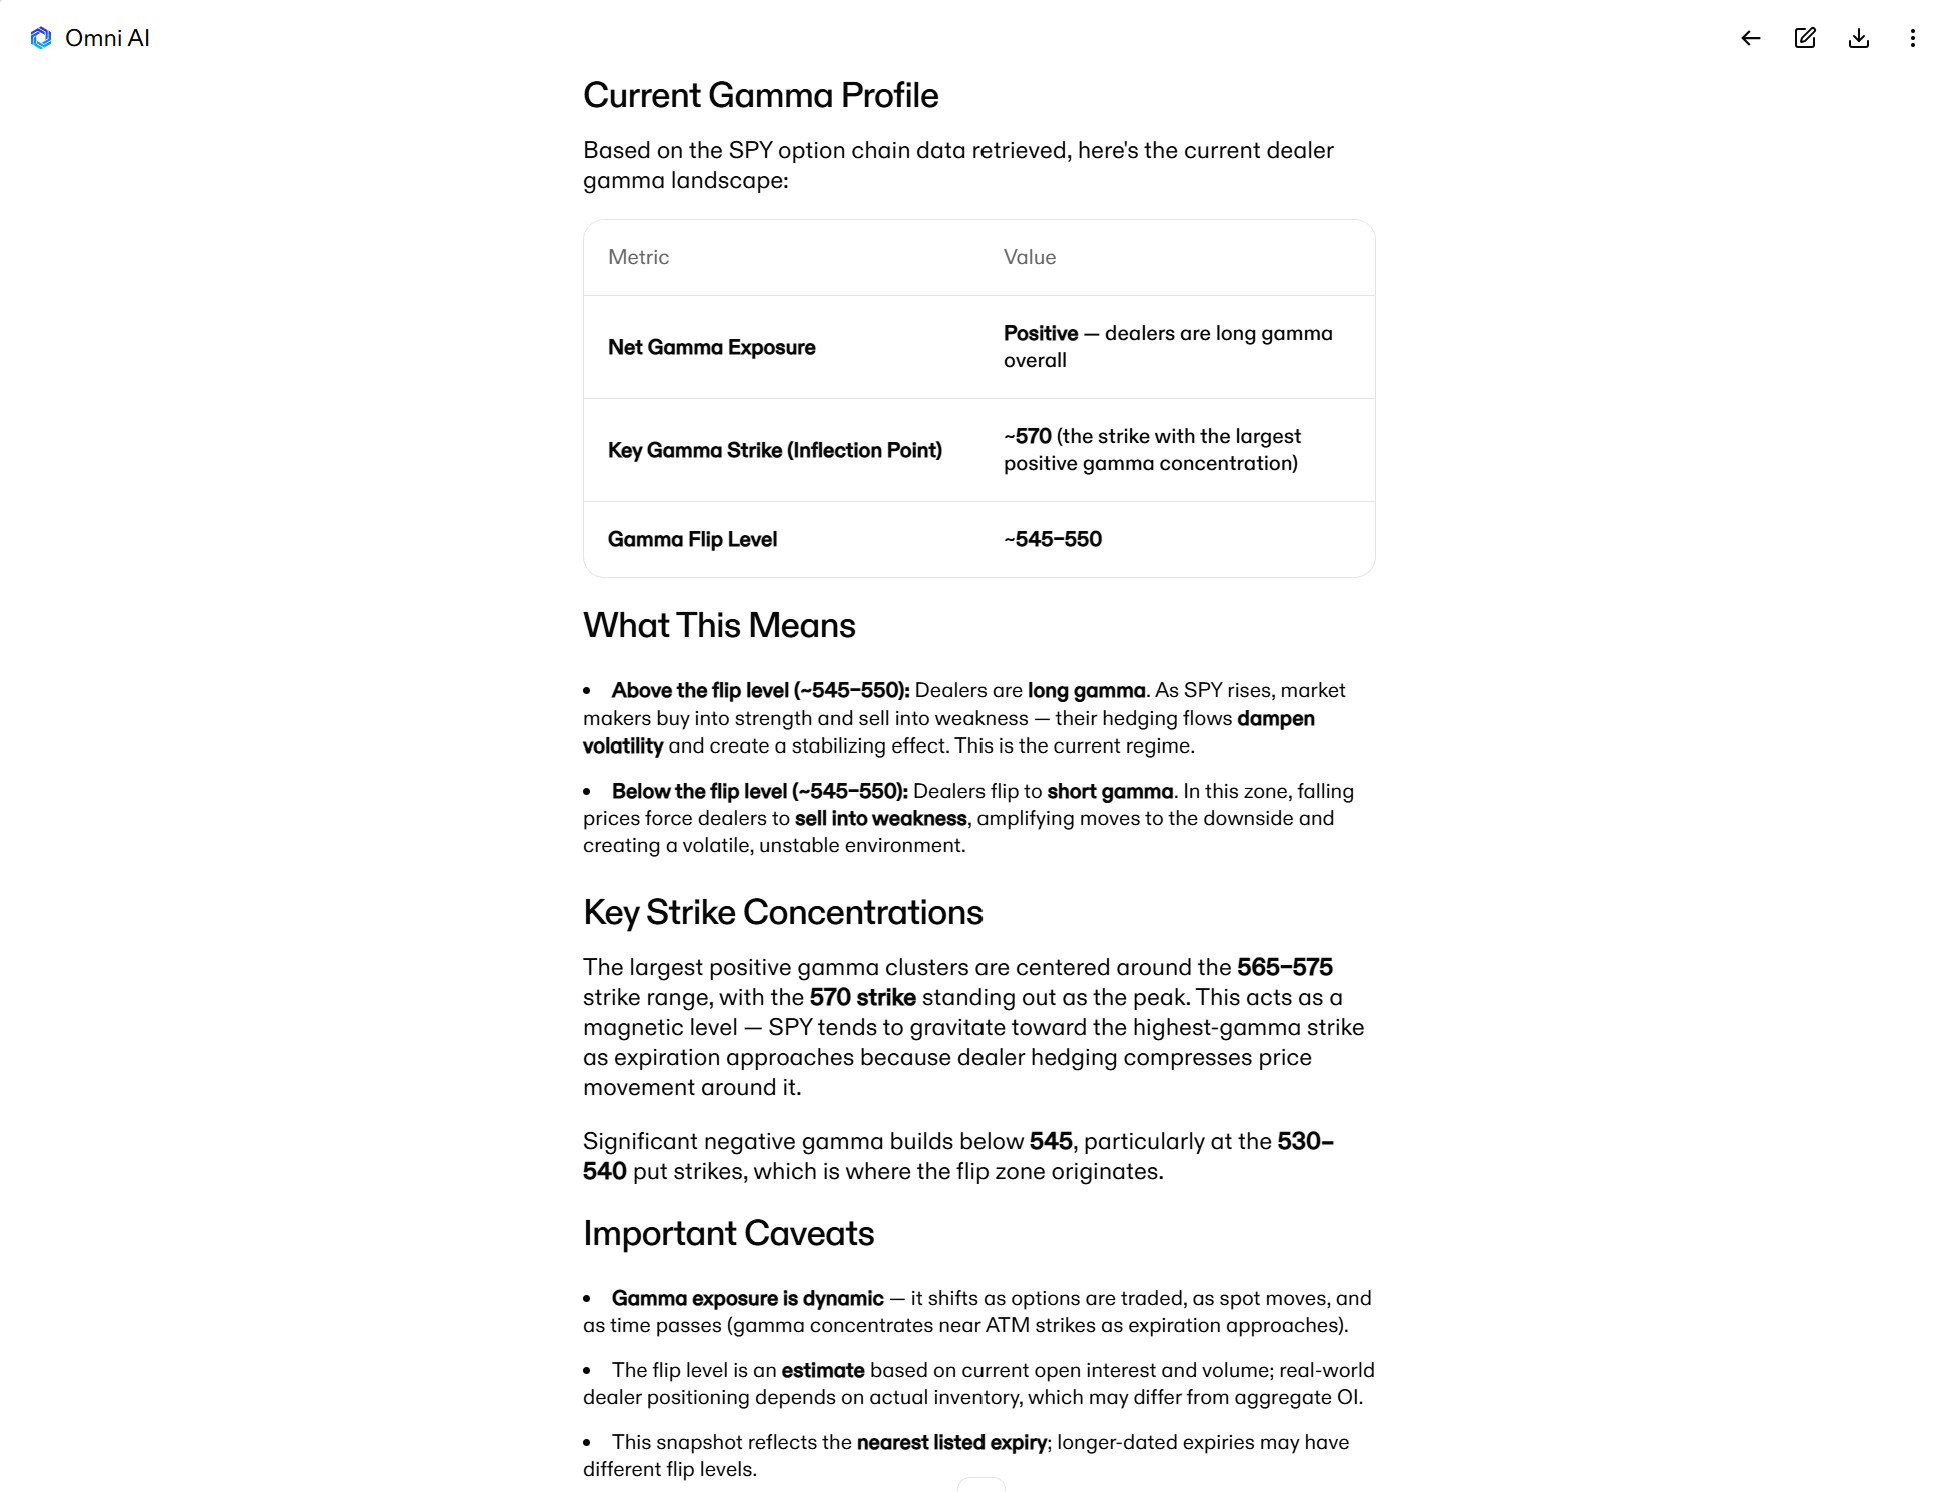
Finally, AI can read options chains to provide information about how dealers are positioned around major indices and how that might impact volatility across the market. Positive net gamma exposure (GEX) typically limits volatility, while negative GEX can accelerate selling if there’s a downside catalyst.
Example prompt: What is the current net gamma exposure across SPY options? What price level will flip dealer positioning from positive to negative?
6. Track earnings season impacts
Earnings season can change the trajectory of the entire market and set the stage for a massive leg up or down. But evaluating macro trends is challenging when some companies beat, some miss, and market reactions don’t always correlate with fundamental changes.
AI can sort through this noise and help you understand the macro signal the market is sending through earnings.
Start by using AI to calculate the implied move in a company’s stock price (from at-the-money straddles) against the actual 1-day post-earnings price swing. Do that across an entire sector or index, and it’s possible to determine whether options positioning is systematically
Example prompt: For S&P 500 companies that reported earnings this week, compare their pre-earnings options-implied moves to their actual 1-day post-earnings price moves. Was options volatility overpriced or underpriced?

Next, use post-earnings price reactions to measure how healthy the market is under the hood. Ask AI to track the average 3-day post-earnings performance for companies that beat estimates vs. those that missed. If beats are getting sold off, that’s a sign the market might be more fragile than it looks. If misses are getting bought, that’s a sign traders are aggressively bullish.
Example prompt: Calculate the average 3-day post-earnings performance for S&P 500 stocks this quarter. Are companies that beat EPS and revenue estimates outperforming the broader market?
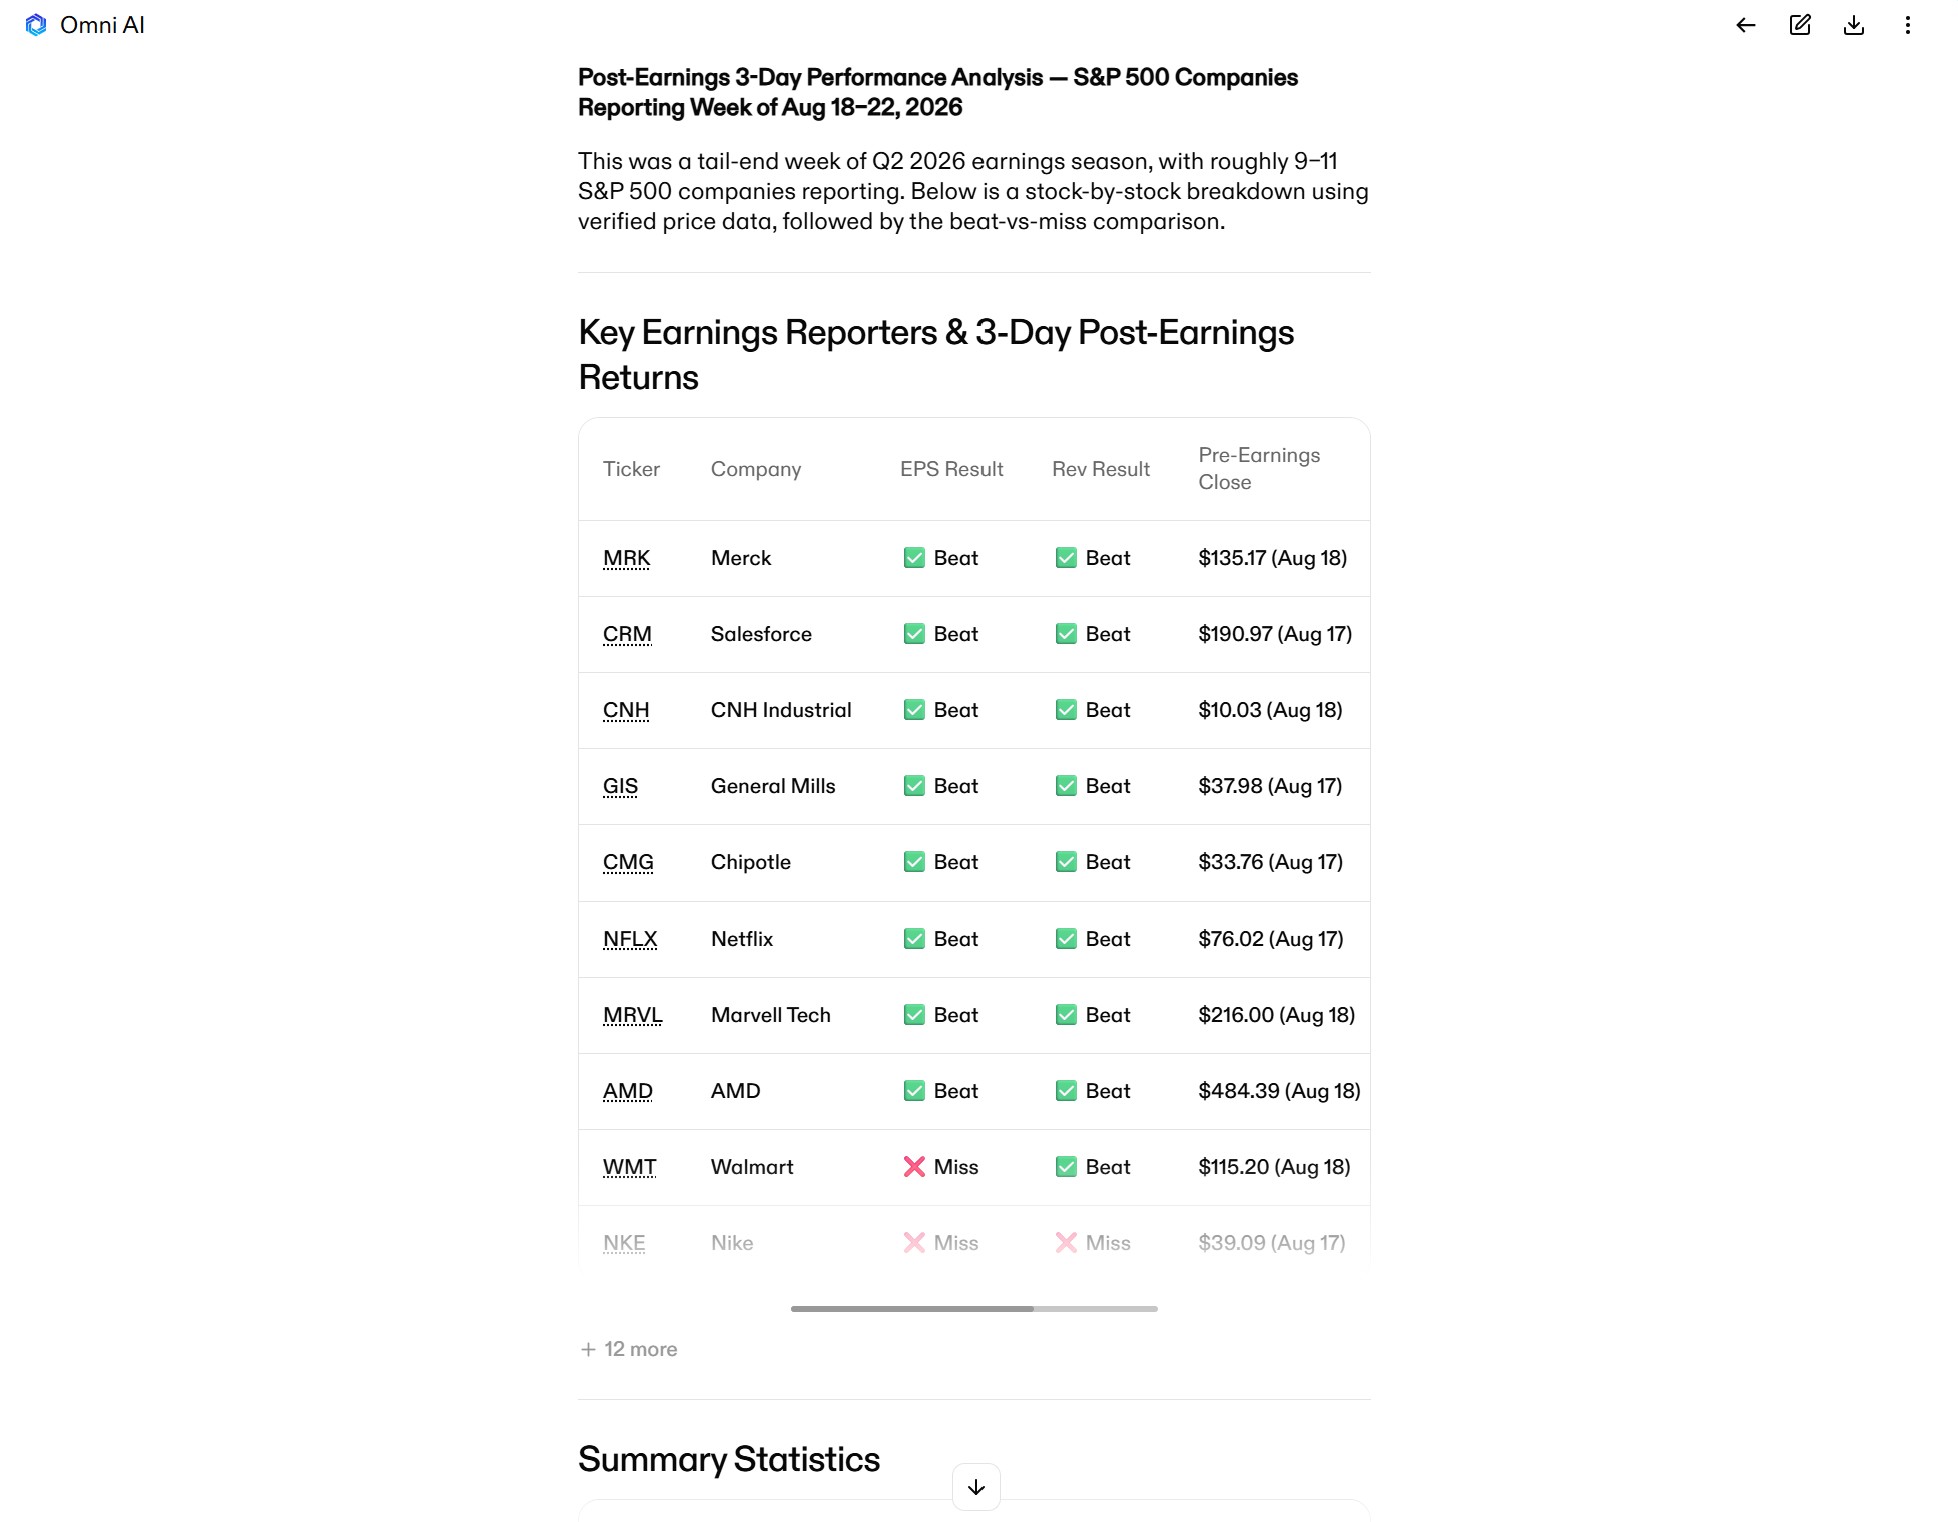
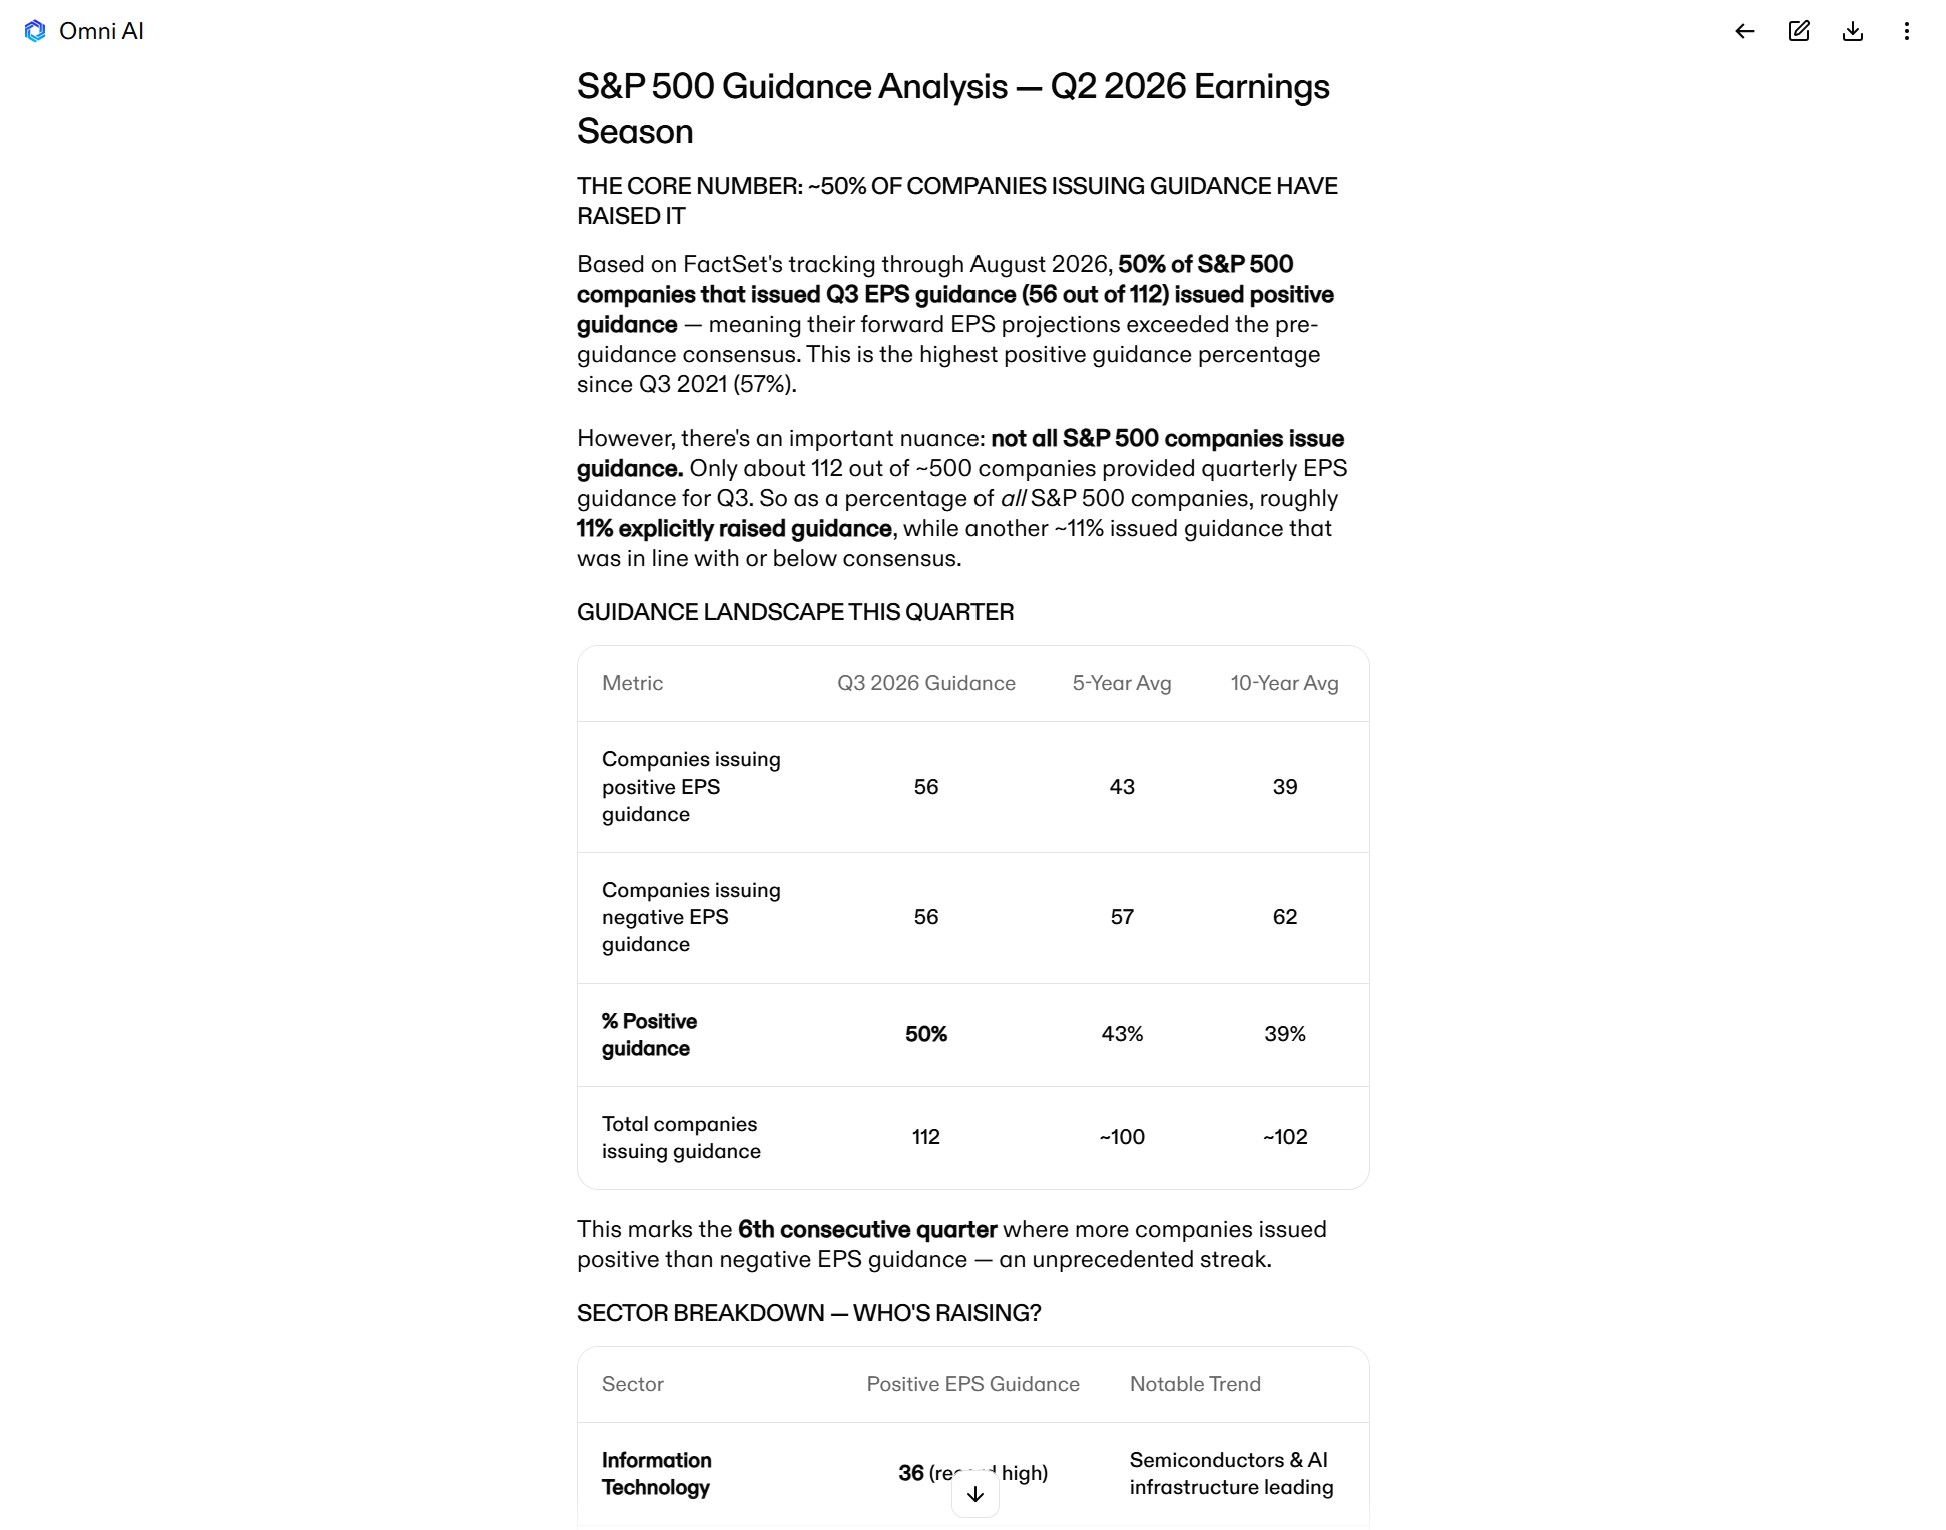
Lastly, leverage AI to aggregate forward guidance from earnings call transcripts and figure out what they say about the market’s fundamentals. If a majority of companies are raising their outlooks, that’s a macro-level signal that corporate earnings could see continued strength and drive the broader market higher.
Example prompt: Analyze earnings call transcripts from all S&P 500 companies that have reported this quarter. What percent of companies raised their full-year guidance?
Putting it all together: Building a daily market report with AI
While these prompts are powerful on their own, the most effective way to use AI for market research is to combine all your checks into a single, standardized market report. That way, you can start each day with a comprehensive and consistent report packed with market intelligence.
Here’s a master prompt to turn Omni AI into your daily market research assistant:
Generate a structured pre-market briefing for today's trading session with these 6 sections:
- Market news and sentiment: Summarize up to 3 key headlines that impacted the market yesterday. Also summarize the bull case and the bear case for SPY over the next month based on commentary from Wall Street analysts.
- Top movers and drivers: List the top 3 pre-market gainers and losers (market cap > $5B) trading on higher-than-average volume. Identify the primary catalyst behind each move.
- Market regime and breadth: Report today's advance/decline ratio for the S&P 500 and calculate the current percentage of S&P 500 stocks above their 50-day and 200-day moving averages. Note whether breadth is confirming or diverging from index price action.
- Sector rotation and cross-asset trends: Rank the top 3 leading and lagging S&P sector ETFs by 5-day relative strength. Flag any notable divergences between equities, VIX, 10-year Treasury yields, and the US Dollar Index.
- Institutional positioning and volatility: Provide the current VIX level, key SPY net gamma exposure levels, and today's options-implied expected move for SPY.
- Earnings volatility: For S&P 500 companies that reported earnings this week, compare their pre-earnings options-implied moves to their actual 1-day post-earnings price moves. Was options volatility overpriced or underpriced?
Run this prompt manually each morning or use Clear Street’s Trading API to place calls to Omni AI directly in your automated workflows. Once you have the information you need to be ready for the trading day, you can dive into analyzing trade opportunities.
Streamline market research with Omni AI
Understanding market context is what separates successful traders from the crowd. AI speeds up deep research, cuts down your daily prep time, and allows you to start every session with a clear, data-backed view of the tape.
If you’re ready to streamline your research workflow, Omni AI is the sidekick you need. It’s powered by real-time quotes and institutional-grade market data, so you get instant analysis without the hallucinations that plague all-purpose AI tools.
Sign up for a Clear Street brokerage account to try Omni AI today.
.avif)
.svg)